
Introduction
Graphs
Blog
Theory
About
Contact
Modeling the Coronavirus epidemic using skew-normal curves
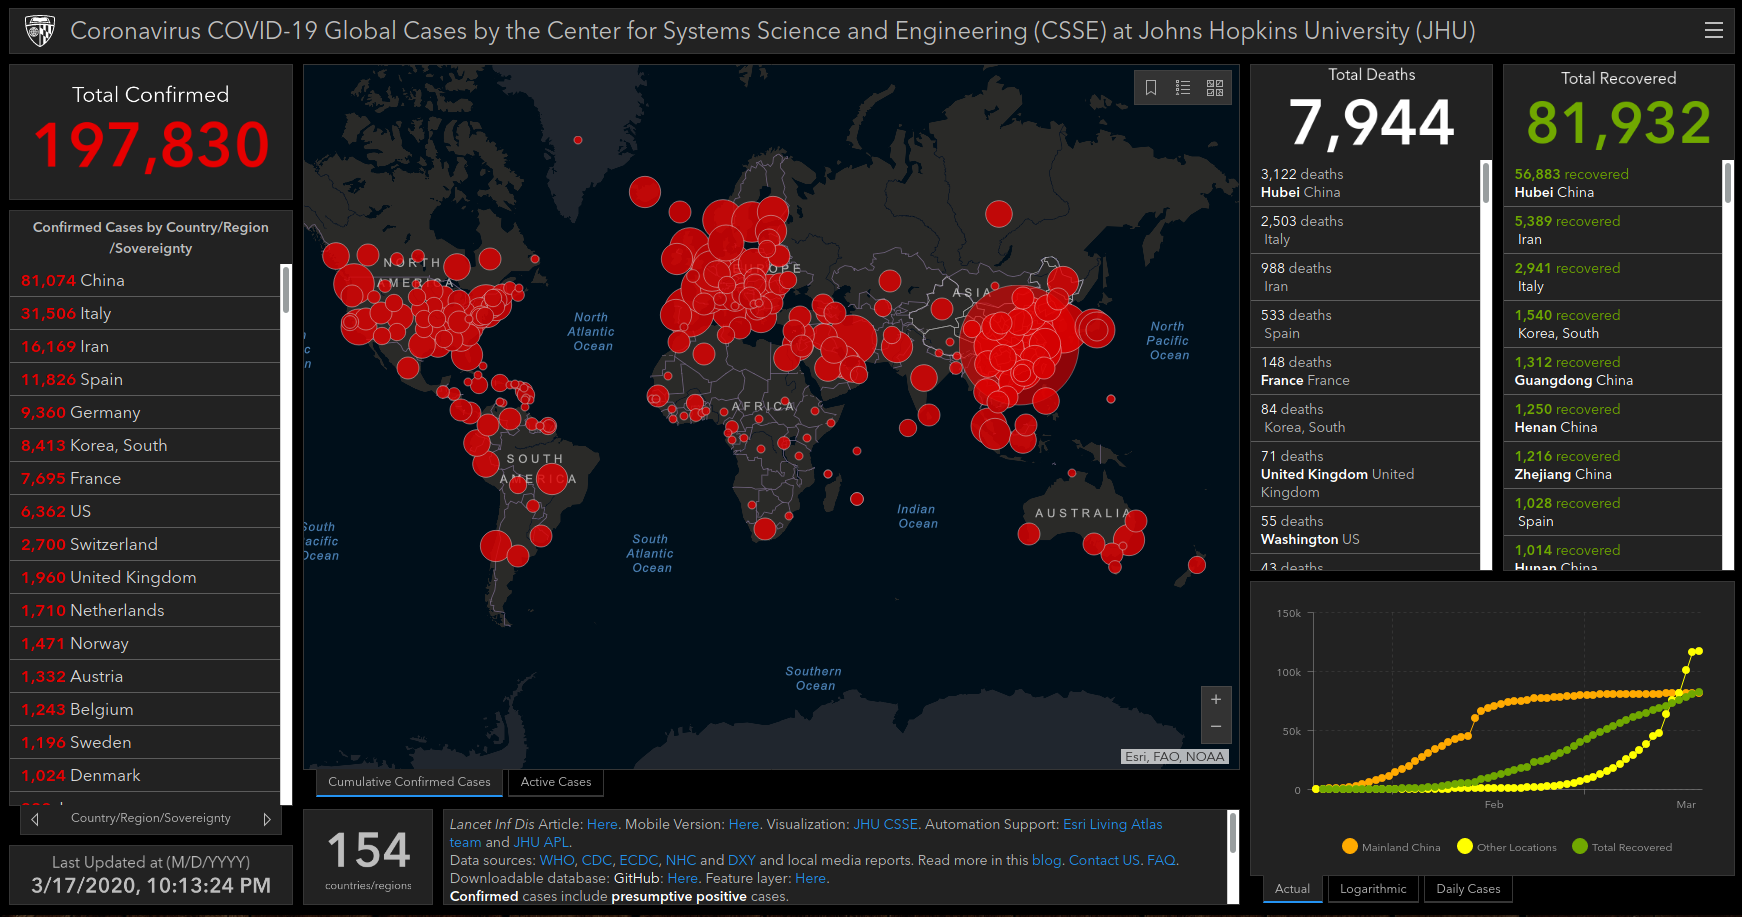 For most of 2020, the nation and the world was glued to an image of
red circles growing larger and larger on a global map
from Johns Hopkins University.
A "novel" virus was spreading rapidly (the image shows the map for March 17, 2020).
For most of 2020, the nation and the world was glued to an image of
red circles growing larger and larger on a global map
from Johns Hopkins University.
A "novel" virus was spreading rapidly (the image shows the map for March 17, 2020).
I got involved in late January, simply for my own curiosity. Because almost all of the early cases
were in China, and because I was not, I started tracking the cases ex-China to get a feel
for how bad the problem was for the rest of the world.
In mid-May the number of deaths per day started to decline, and I realized that a skew-normal
curve was a good fit to the data. As the epidemic progressed we had a second smaller wave in
the summer, and then a third larger wave in the fall.
This web page describes the math involved, the various charts and projections throughout the year,
and the algorithms used to fit the curves.
Disclaimer: none of this has been peer-reviewed.
My credentials allow me to make statements about math, but not medicine.
My goal is to explain the math to you so that you can draw your own
conclusions about the state of the public heath threat.
Sections
- Introduction
- The motivation for this project (this page).
- Graphs
- The major product of this effort is a set of graphs and charts.
- Blog
- This section describes the progression of various models as the data from the epidemic trickled in day-by-day.
- Theory
- For the math-inclined this section describes the equations behind the skew-normal probbility distribution.
- About
- Who is this "Fuzzy" guy, anyway?
- Contact
- Mailing addresses, emails, and social media URL's
Last updated 28-Apr-2022 by fuzzy@lazytoad.com,
from Lazy Toad Ranch
Web Site contents Copyright © 2000-2022 by Michael Mauldin