
 |
 |
 |
 |
|
 |
 |
 |
 |
 |
 |
 |
 |
 |
 |
 |
 |
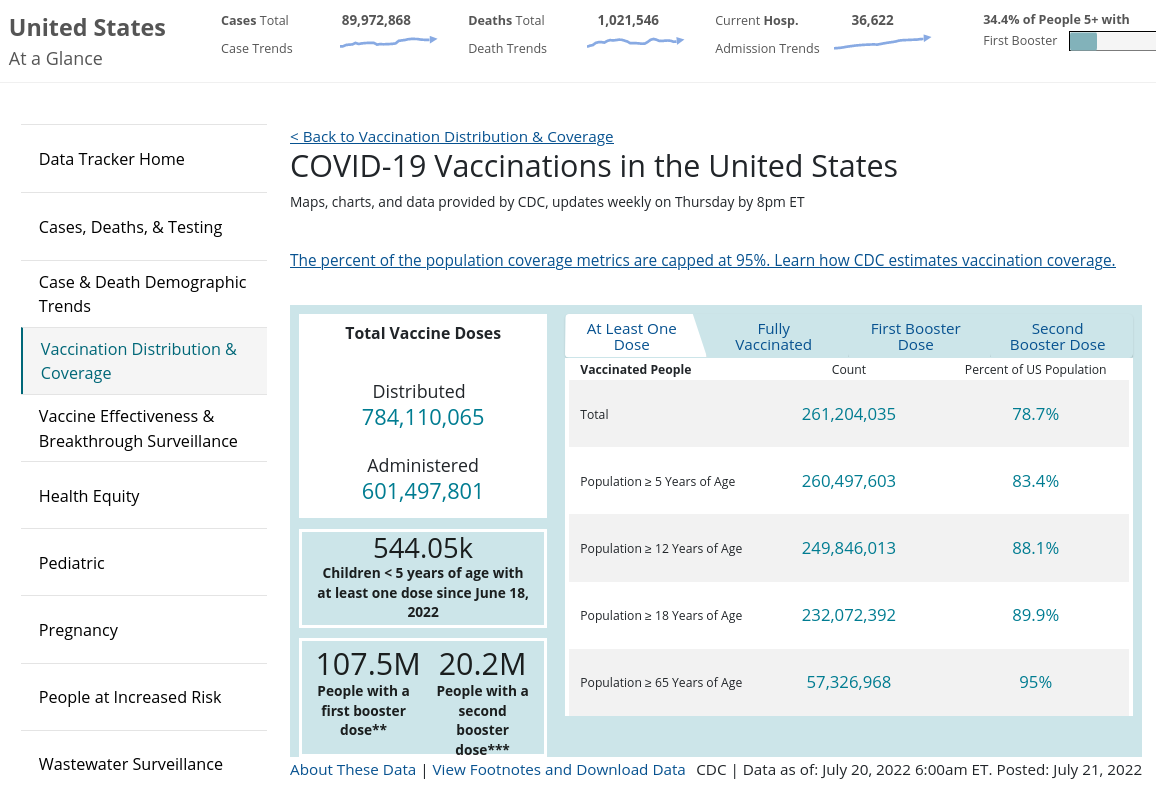
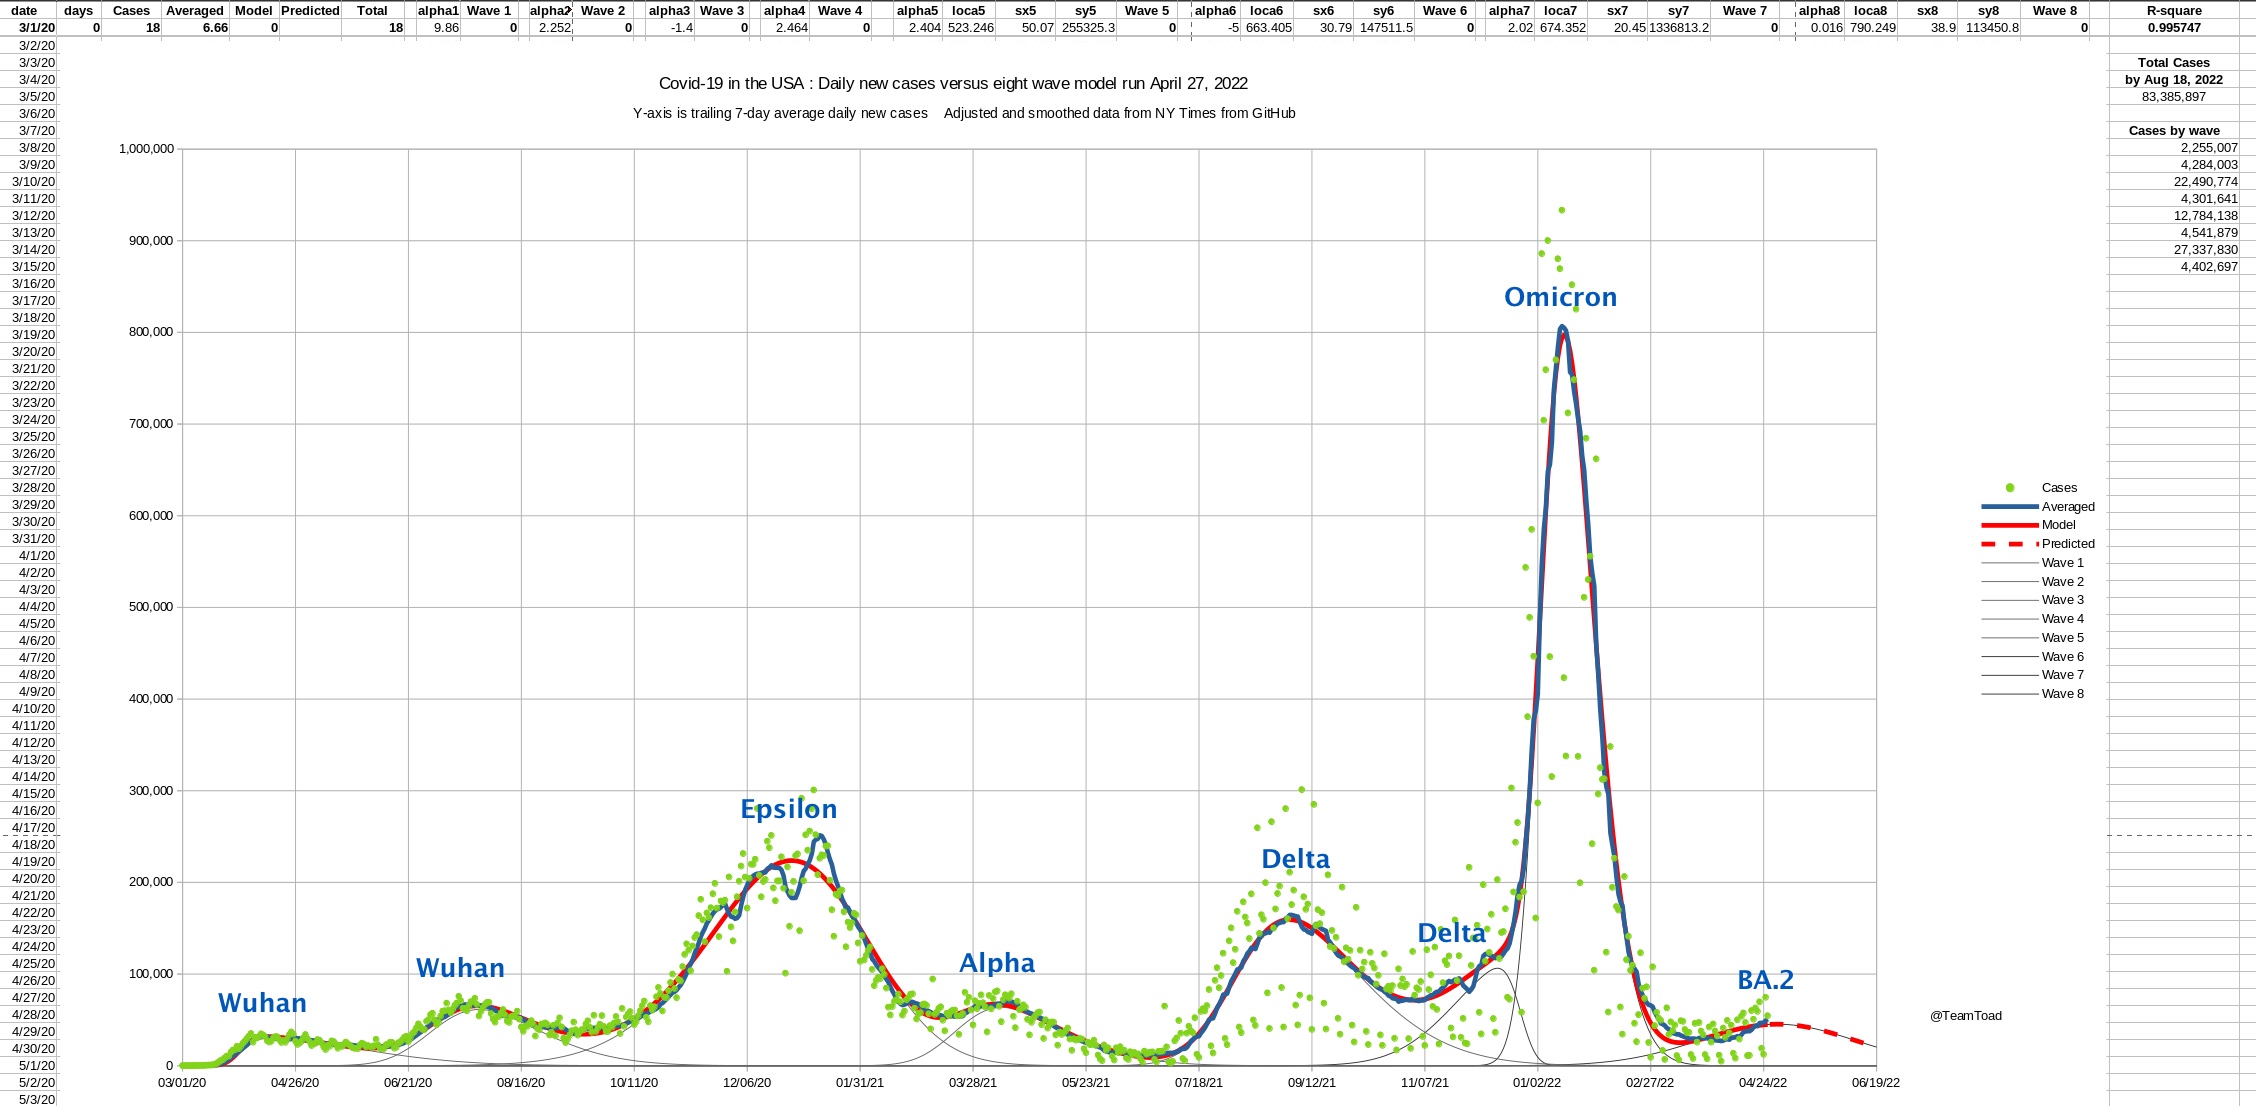
as of April 27, 2022 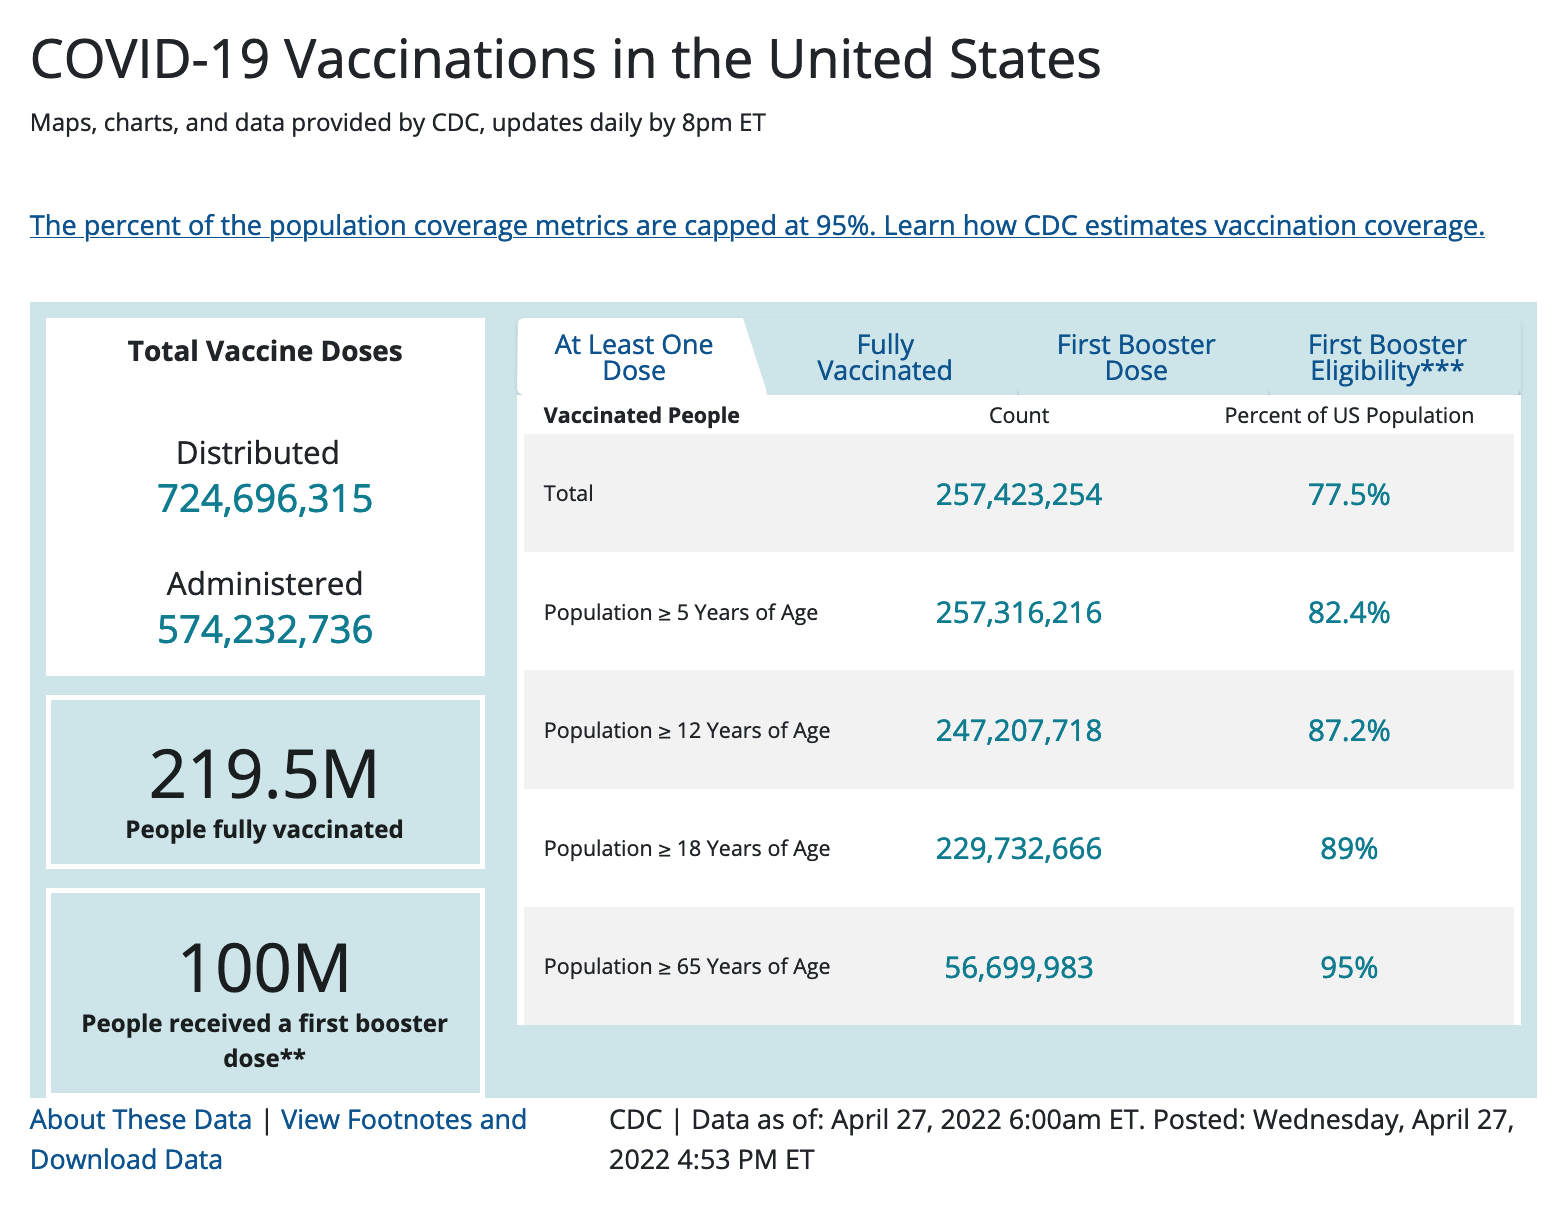
|
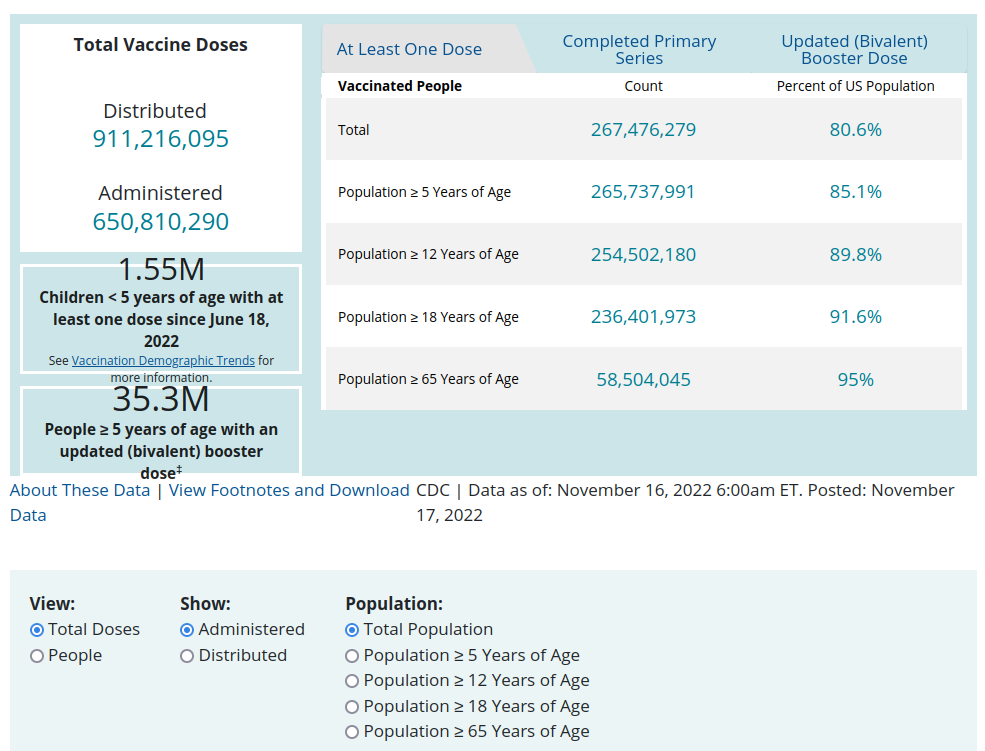
According to the CDC
vaccine tracker,
219.5 million Americans are fully vaccinated.
|
 |
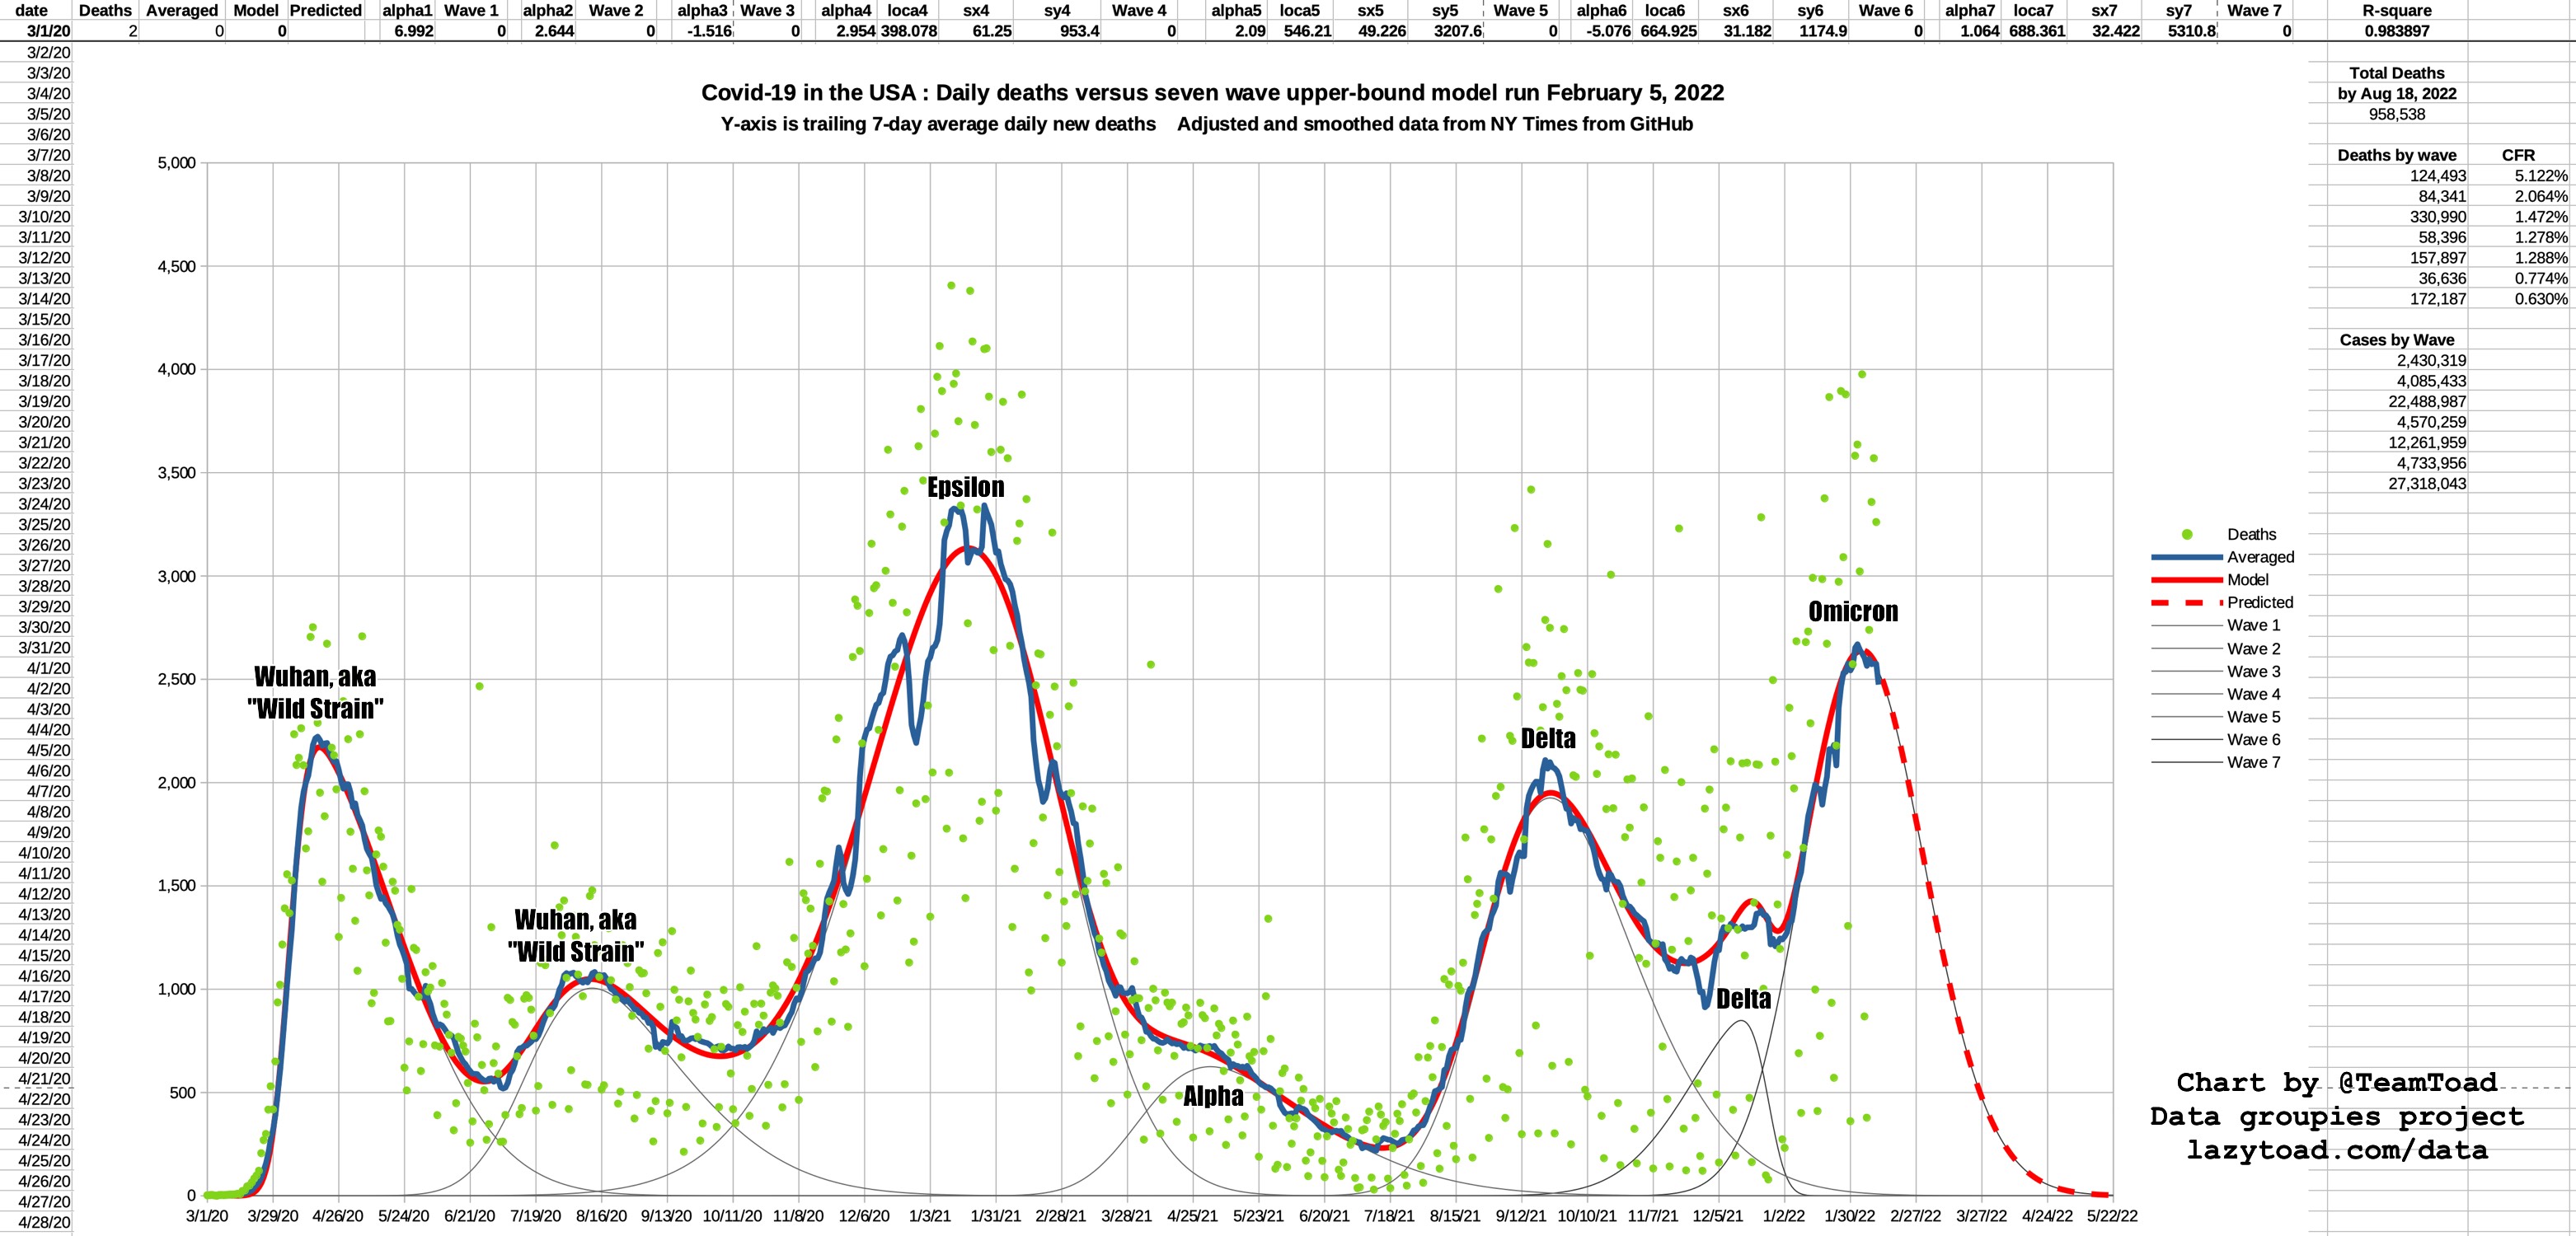 |
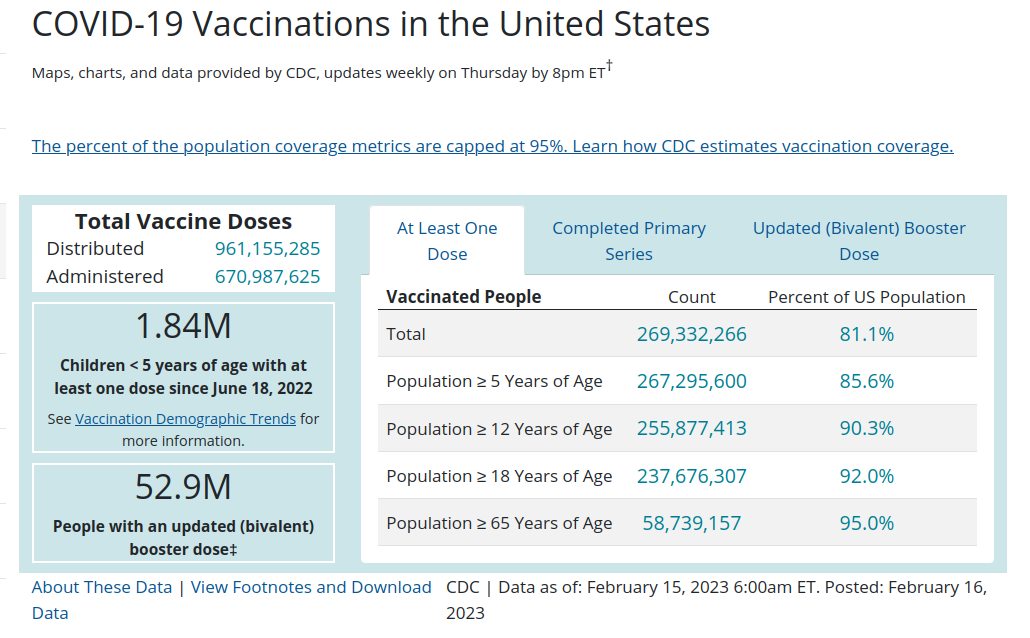
as of February 12, 2022 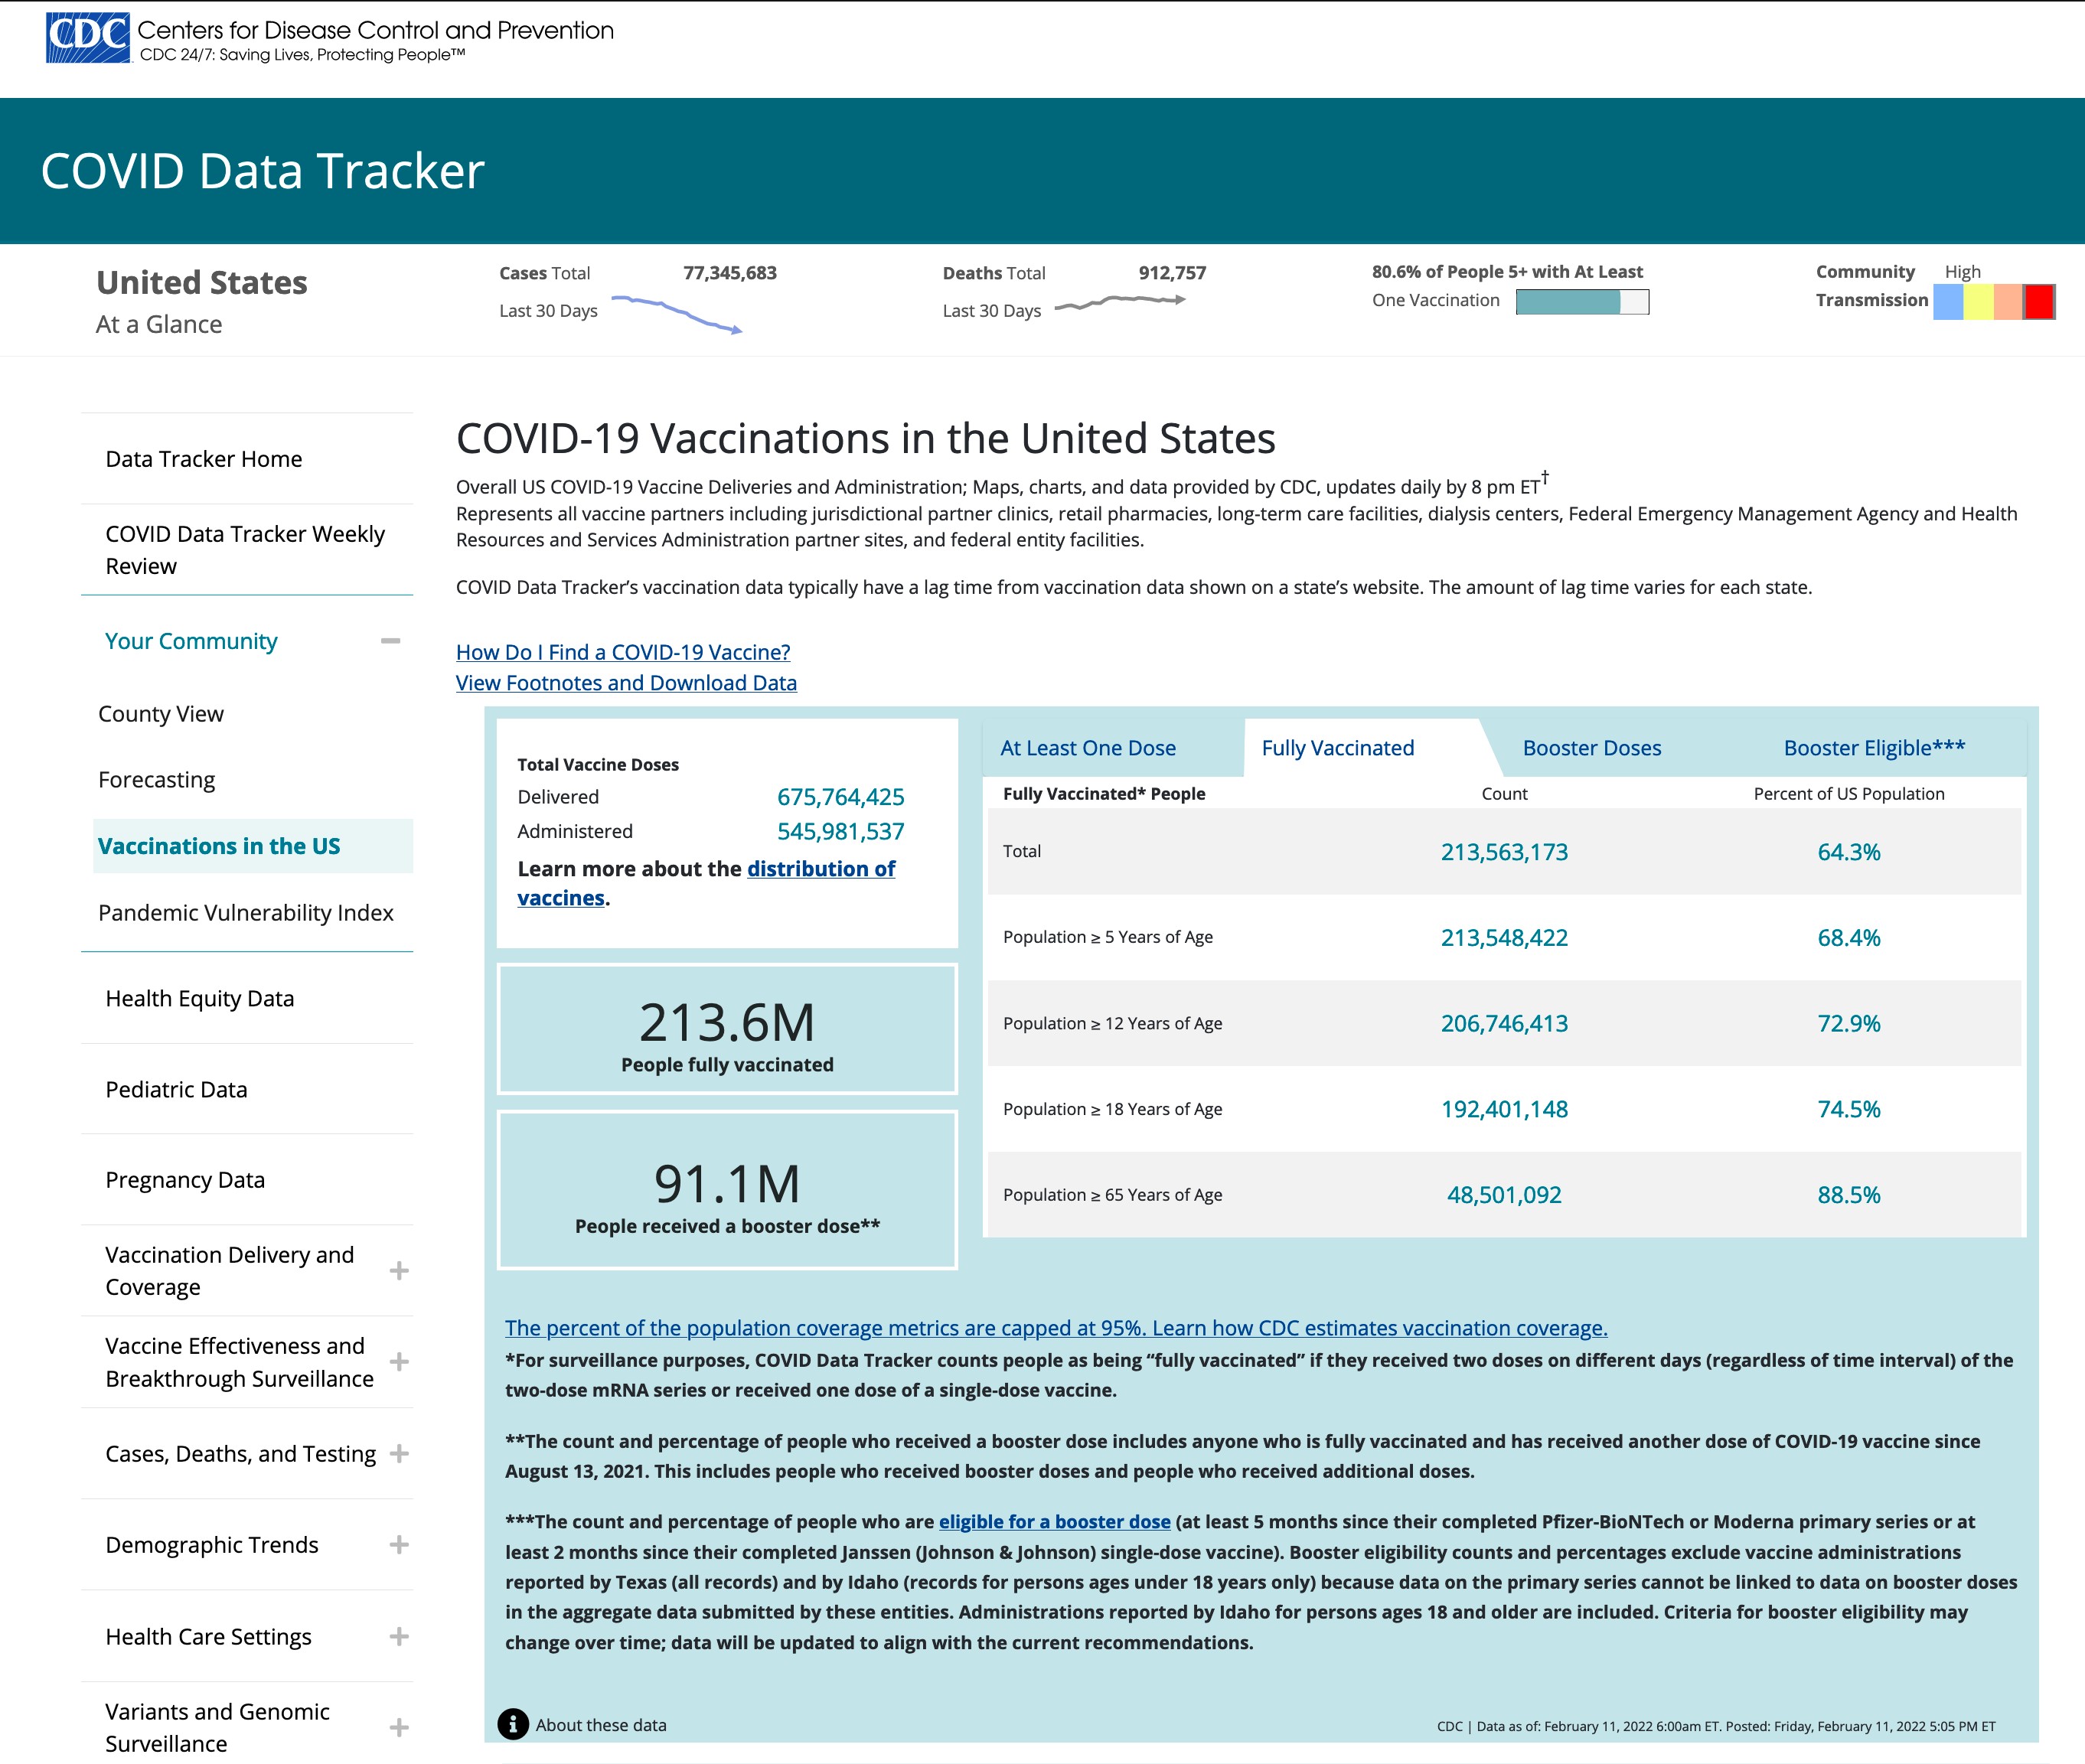
|
According to the CDC
vaccine tracker,
204.6 million Americans are fully vaccinated (61.6% of the whole population).
|
 |
 |
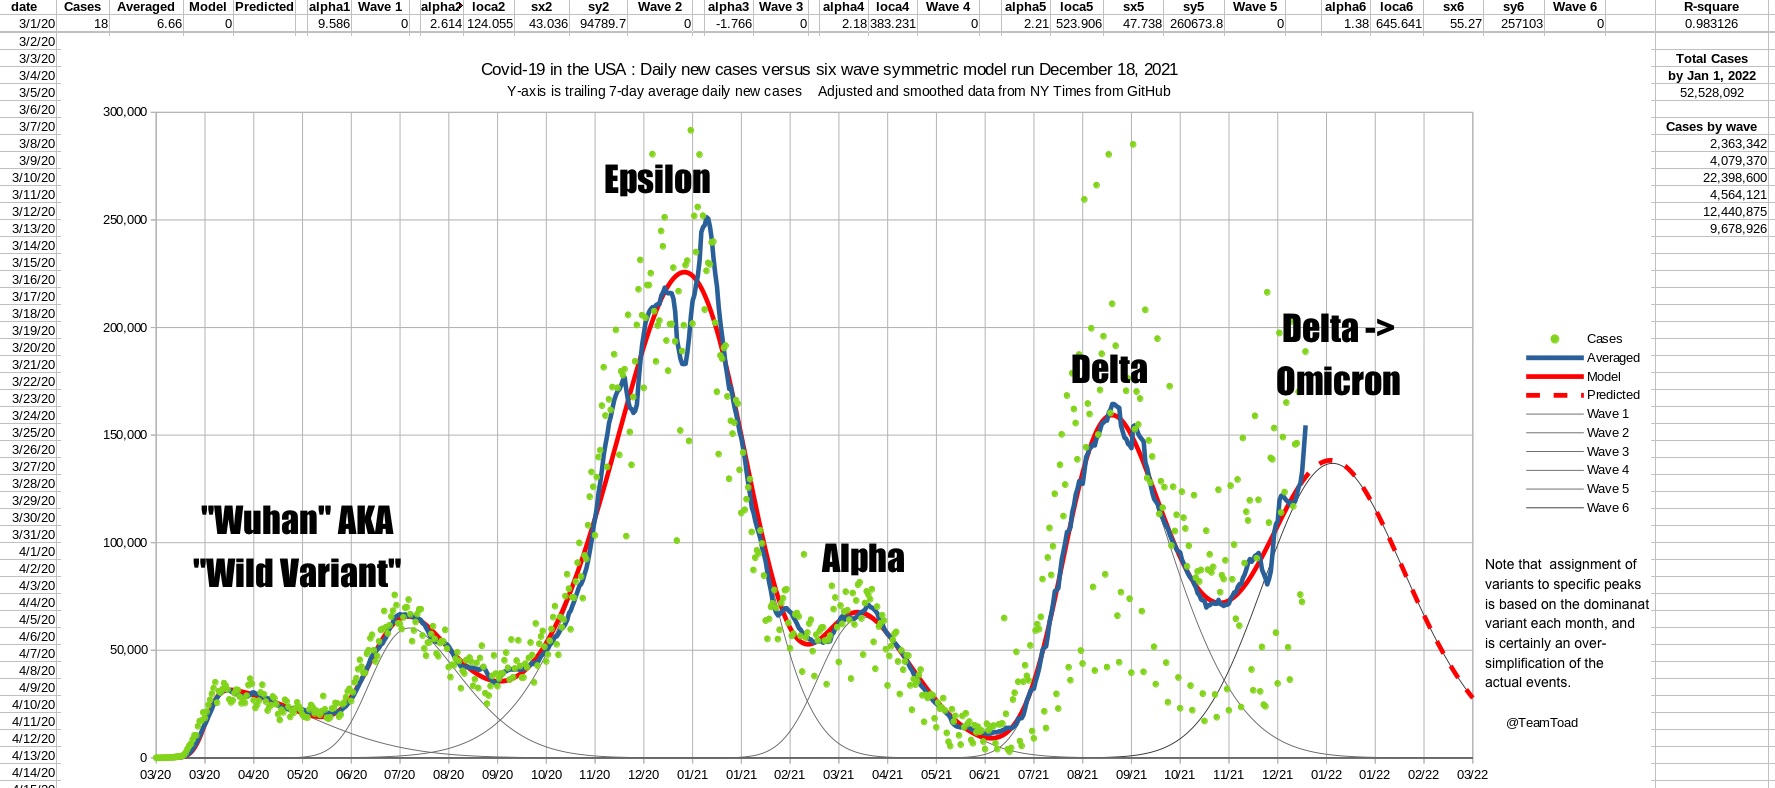
as of December 21, 2021 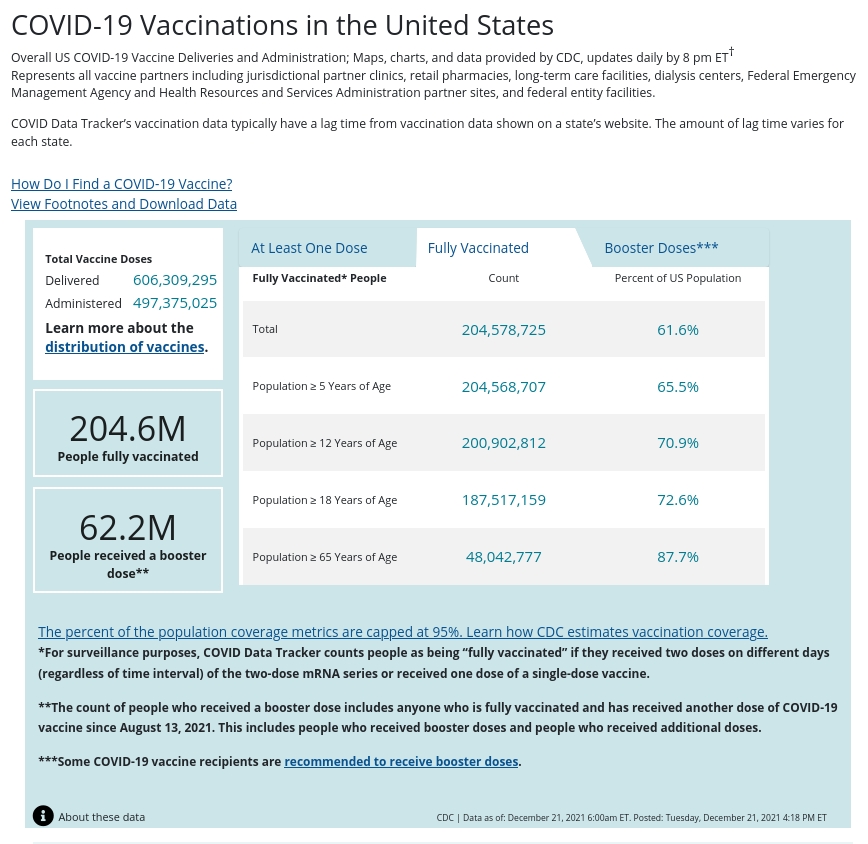
|
According to the CDC
vaccine tracker,
204.6 million Americans are fully vaccinated (61.6% of the whole population).
|
 |
 |
 |
 |
as of September 4, 2021 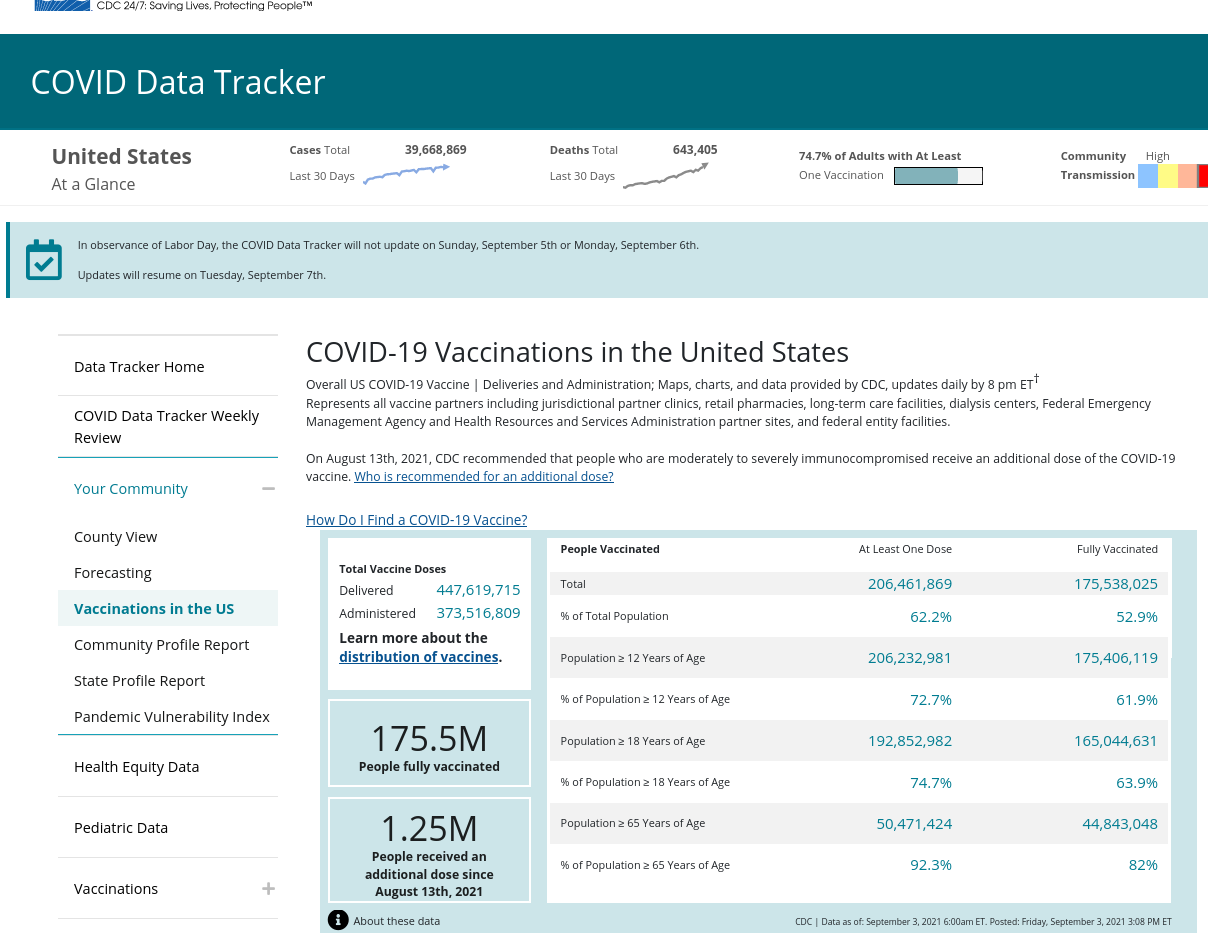
|
According to the CDC
vaccine tracker,
206,461,869 have received at least one dose of
vaccine as of May 8, 2021.
|
 |
 |
 |
 |
as of April 17, 2021 at 9am CDT 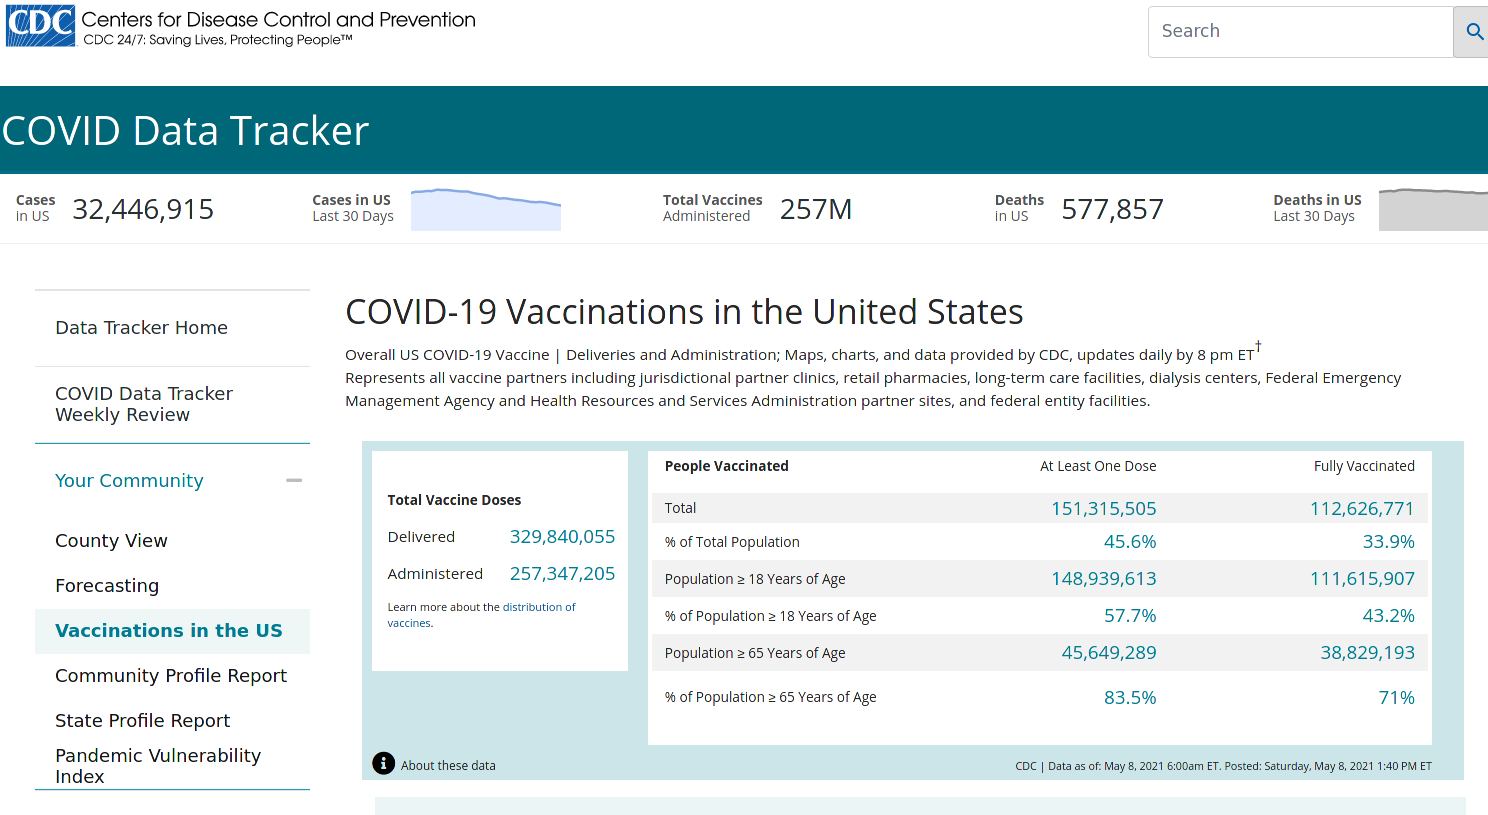
|
According to the CDC
vaccine tracker,
151,315,505 have received at least one dose of
vaccine as of May 8, 2021.
Included in that 151M are 112,626,771 people who are fully vaccinated, having either received both doses of the Pfizer or Moderna vaccine, or one dose of the J&J vaccine. |
 |
 |
 |
 |
 |
 |
as of April 17, 2021 at 9am CDT 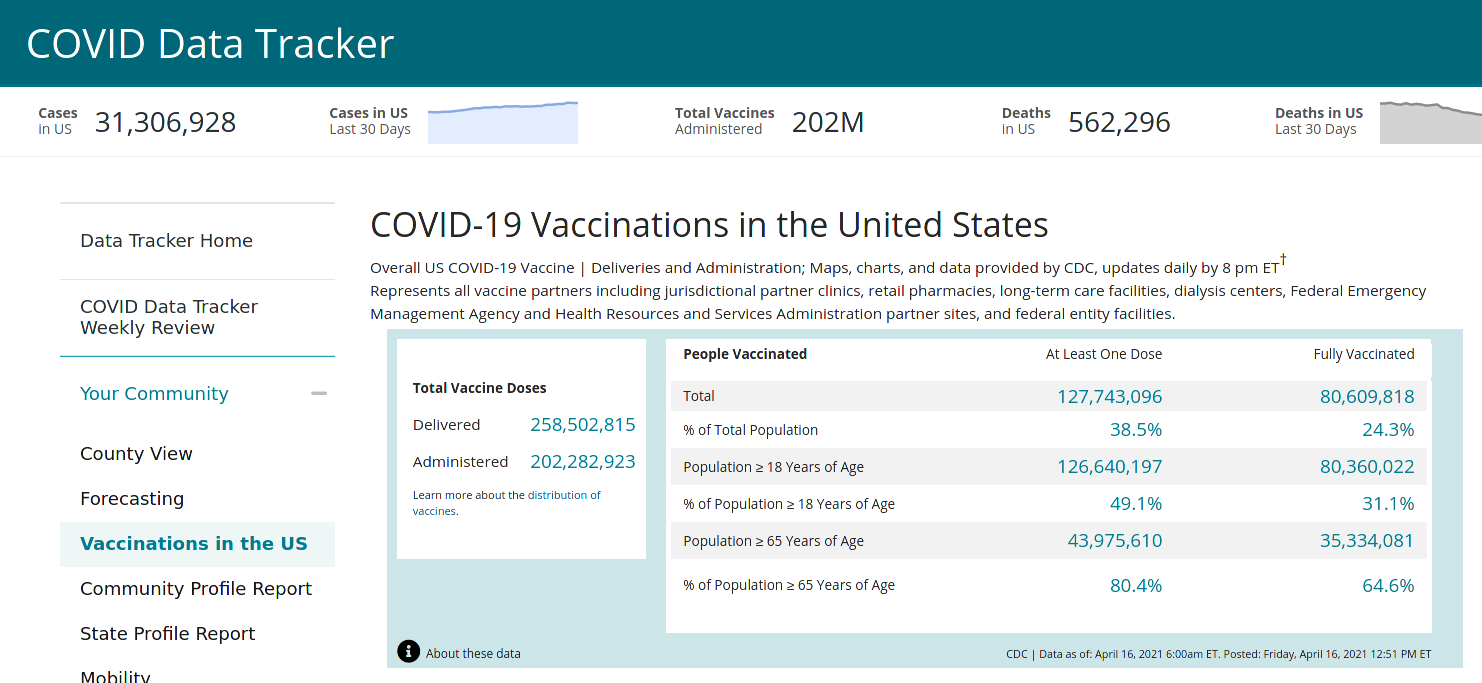
|
According to the CDC
vaccine tracker,
127,743,096 have received at least one dose of vaccine as of April 16, 2021.
Included in that 127M are 80,609,818 people who are fully vaccinated, having either received both doses of the Pfizer or Moderna vaccine, or one dose of the J&J vaccine. |
 |
 |
 |
as of April 3, 2021 at 9am CDT 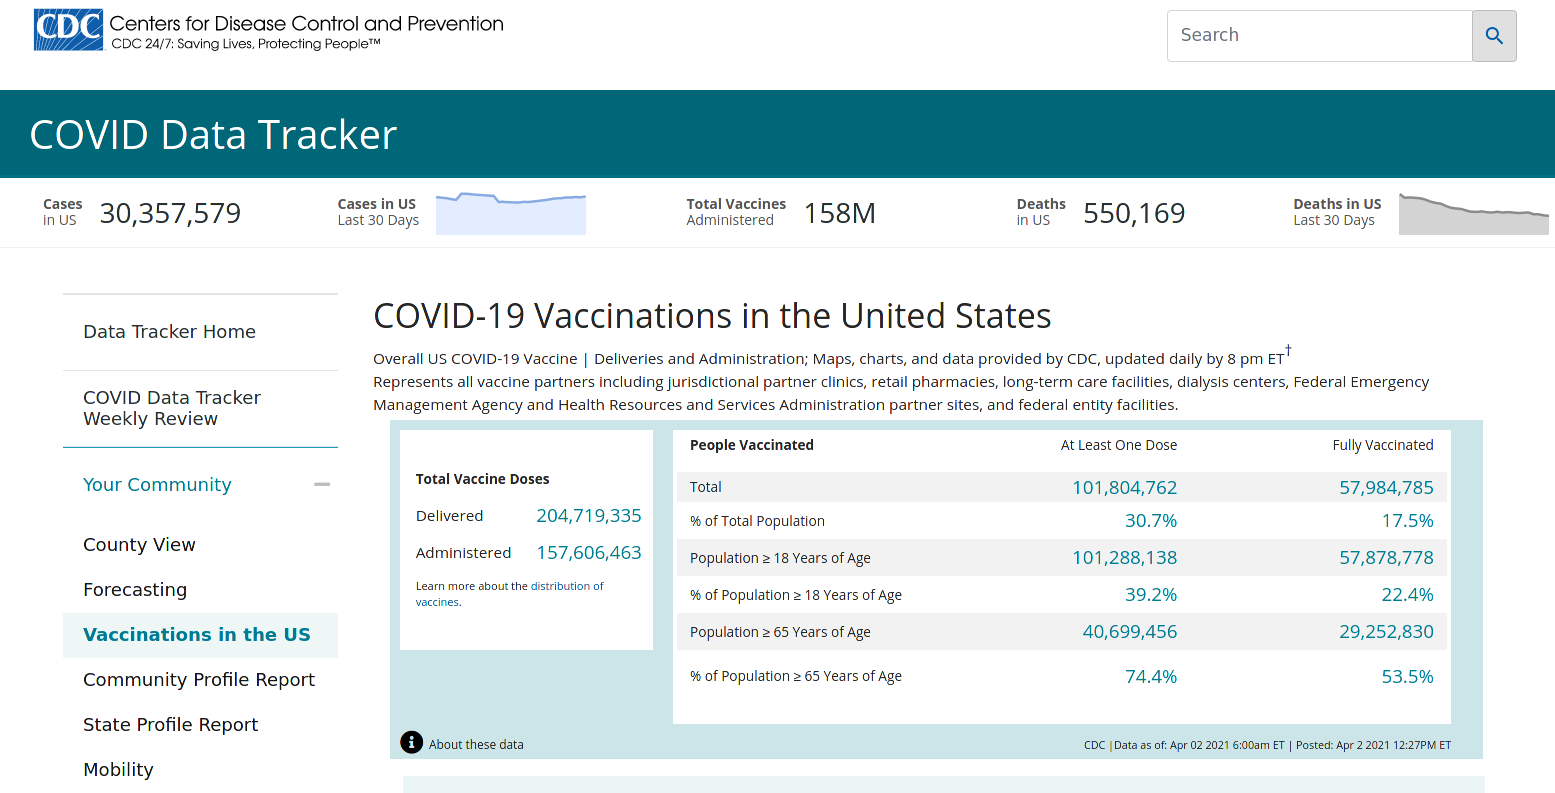
|
According to the CDC
vaccine tracker,
101,288,138 have received 1 or 2 doses of one of the two vaccines as of April 2, 2021.
Included in that 101M are 40,699,456 people who have received both doses. |
 |
 |
 |
 |
as of March 28, 2021 at 5pm CDT 
|
According to the CDC
vaccine tracker,
91,417,268 have received 1 or 2 doses of one of the two vaccines as of March 27, 2021.
Included in that 91M are 39,273,886 people who have received both doses. |
 |
 |
as of March 20, 2021 at 5pm CDT 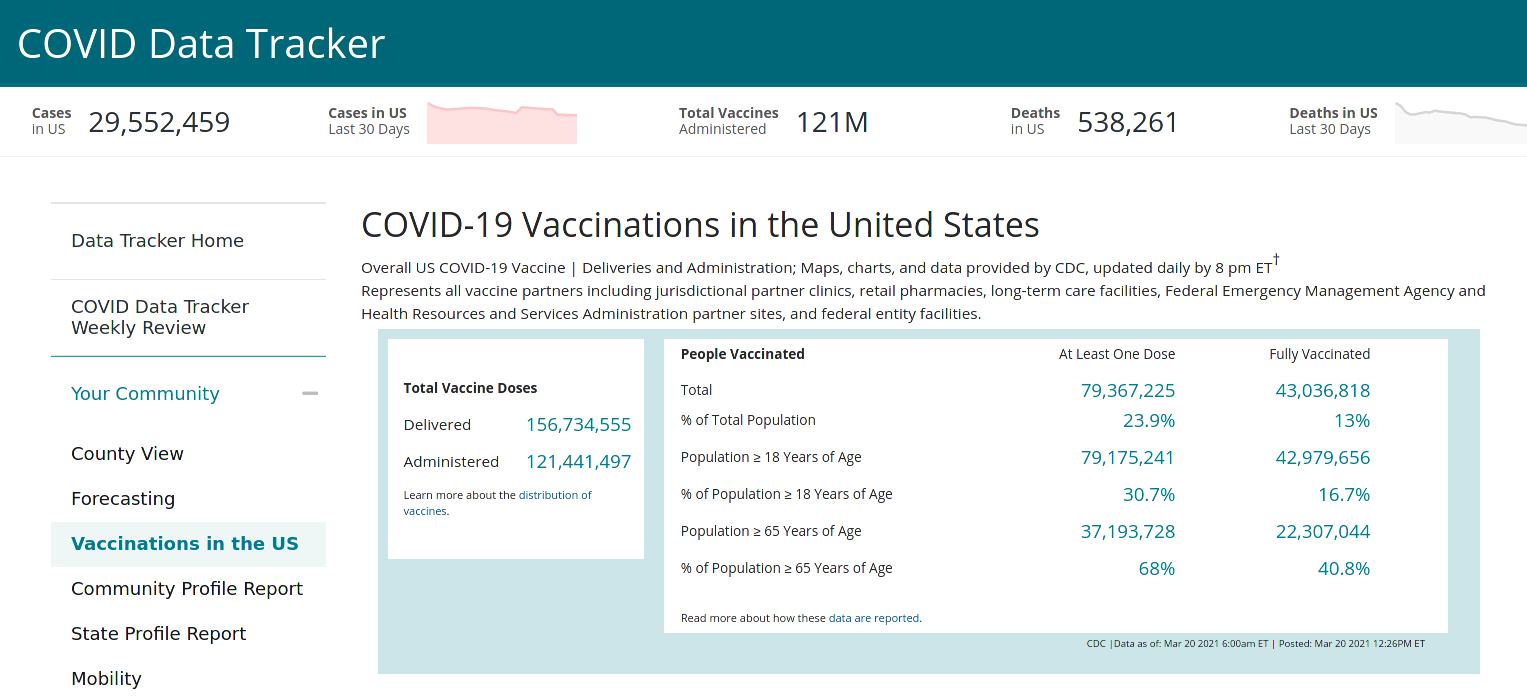
|
According to the CDC
vaccine tracker,
79,175,241 have received 1 or 2 doses of one of the two vaccines as of March 20, 2021.
Included in that 79M are 37,193,728 people who have received both doses. |
 |
 |
as of March 6, 2021 at 2pm CDT 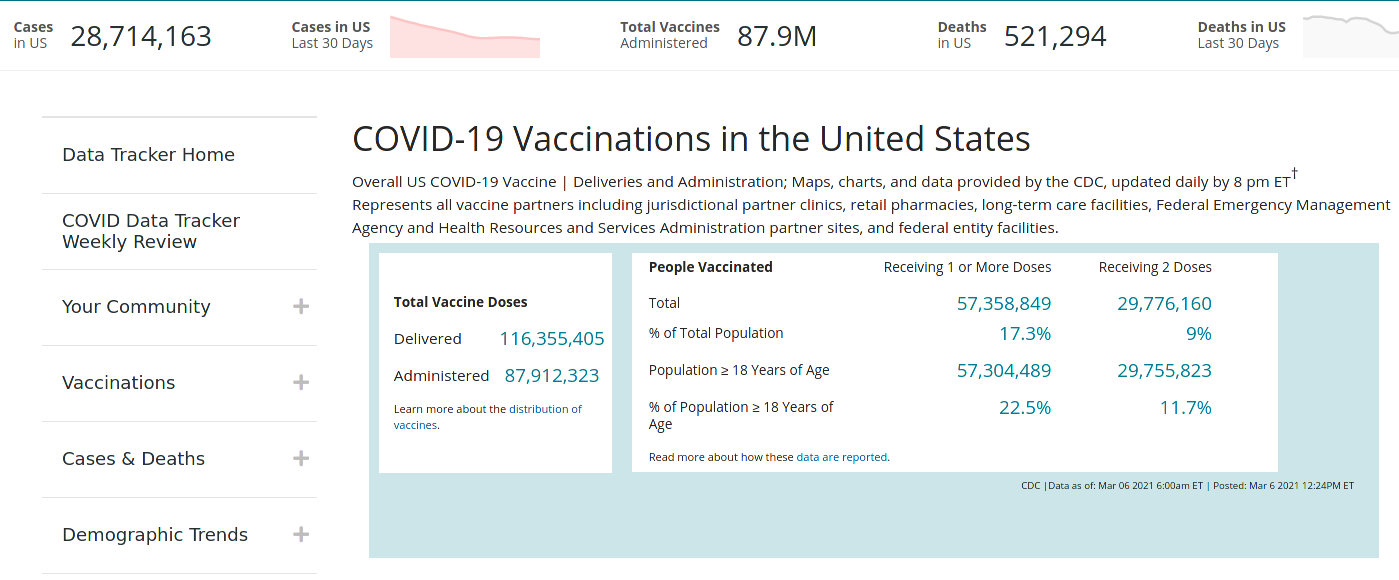
|
According to the CDC
vaccine tracker,
57,358,849 have received 1 or 2 doses of one of the two vaccines as of March 6, 2021.
Included in that 57M are 29,776,160 people who have received both doses. |
 |
 |
|
|
 |
 |
as of February 20, 2021 at 10am CDT 
|
According to the CDC
vaccine tracker,
41,977,401 have received 1 or 2 doses of one of the two vaccines as of Feb 19, 2021.
Included in that 41.98M are 17,039,118 people have received both doses. |
 |
 |
|
|

|
 |
 |
as of February 5, 2021 at 6pm CDT 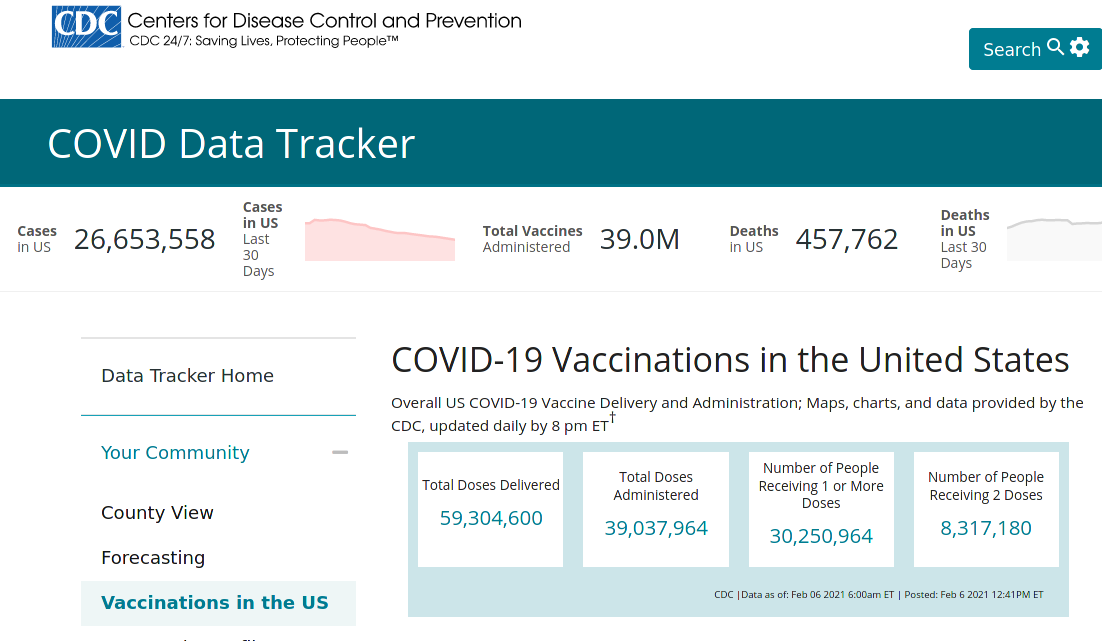
|
According to the CDC
vaccine tracker,
30,250,964 have received 1 or 2 doses of one of the two vaccines as of Feb. 5, 2021.
Included in that 30.2M are 8,317,180 people who have received both doses. |
 |
 |
as of January 30, 2021 at 9am CDT 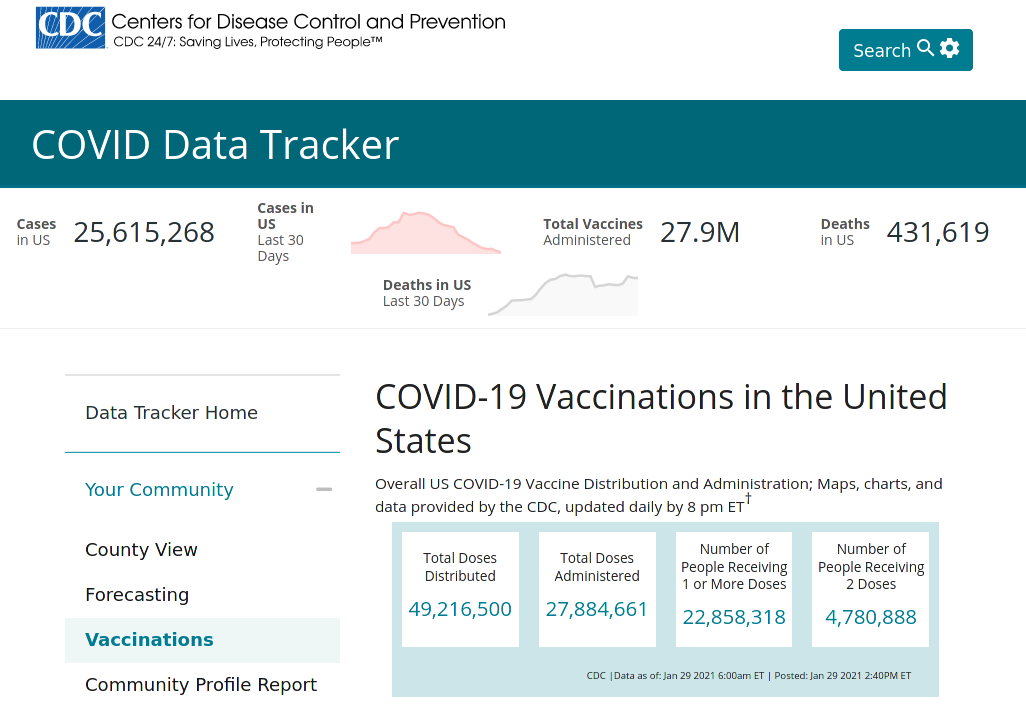
|
According to the CDC
vaccine tracker,
22,858,318 have received 1 or 2 doses of one of the two vaccines as of Jan 29, 2021.
Included in that 22.9M are 4,780,888 people who have received both doses. |
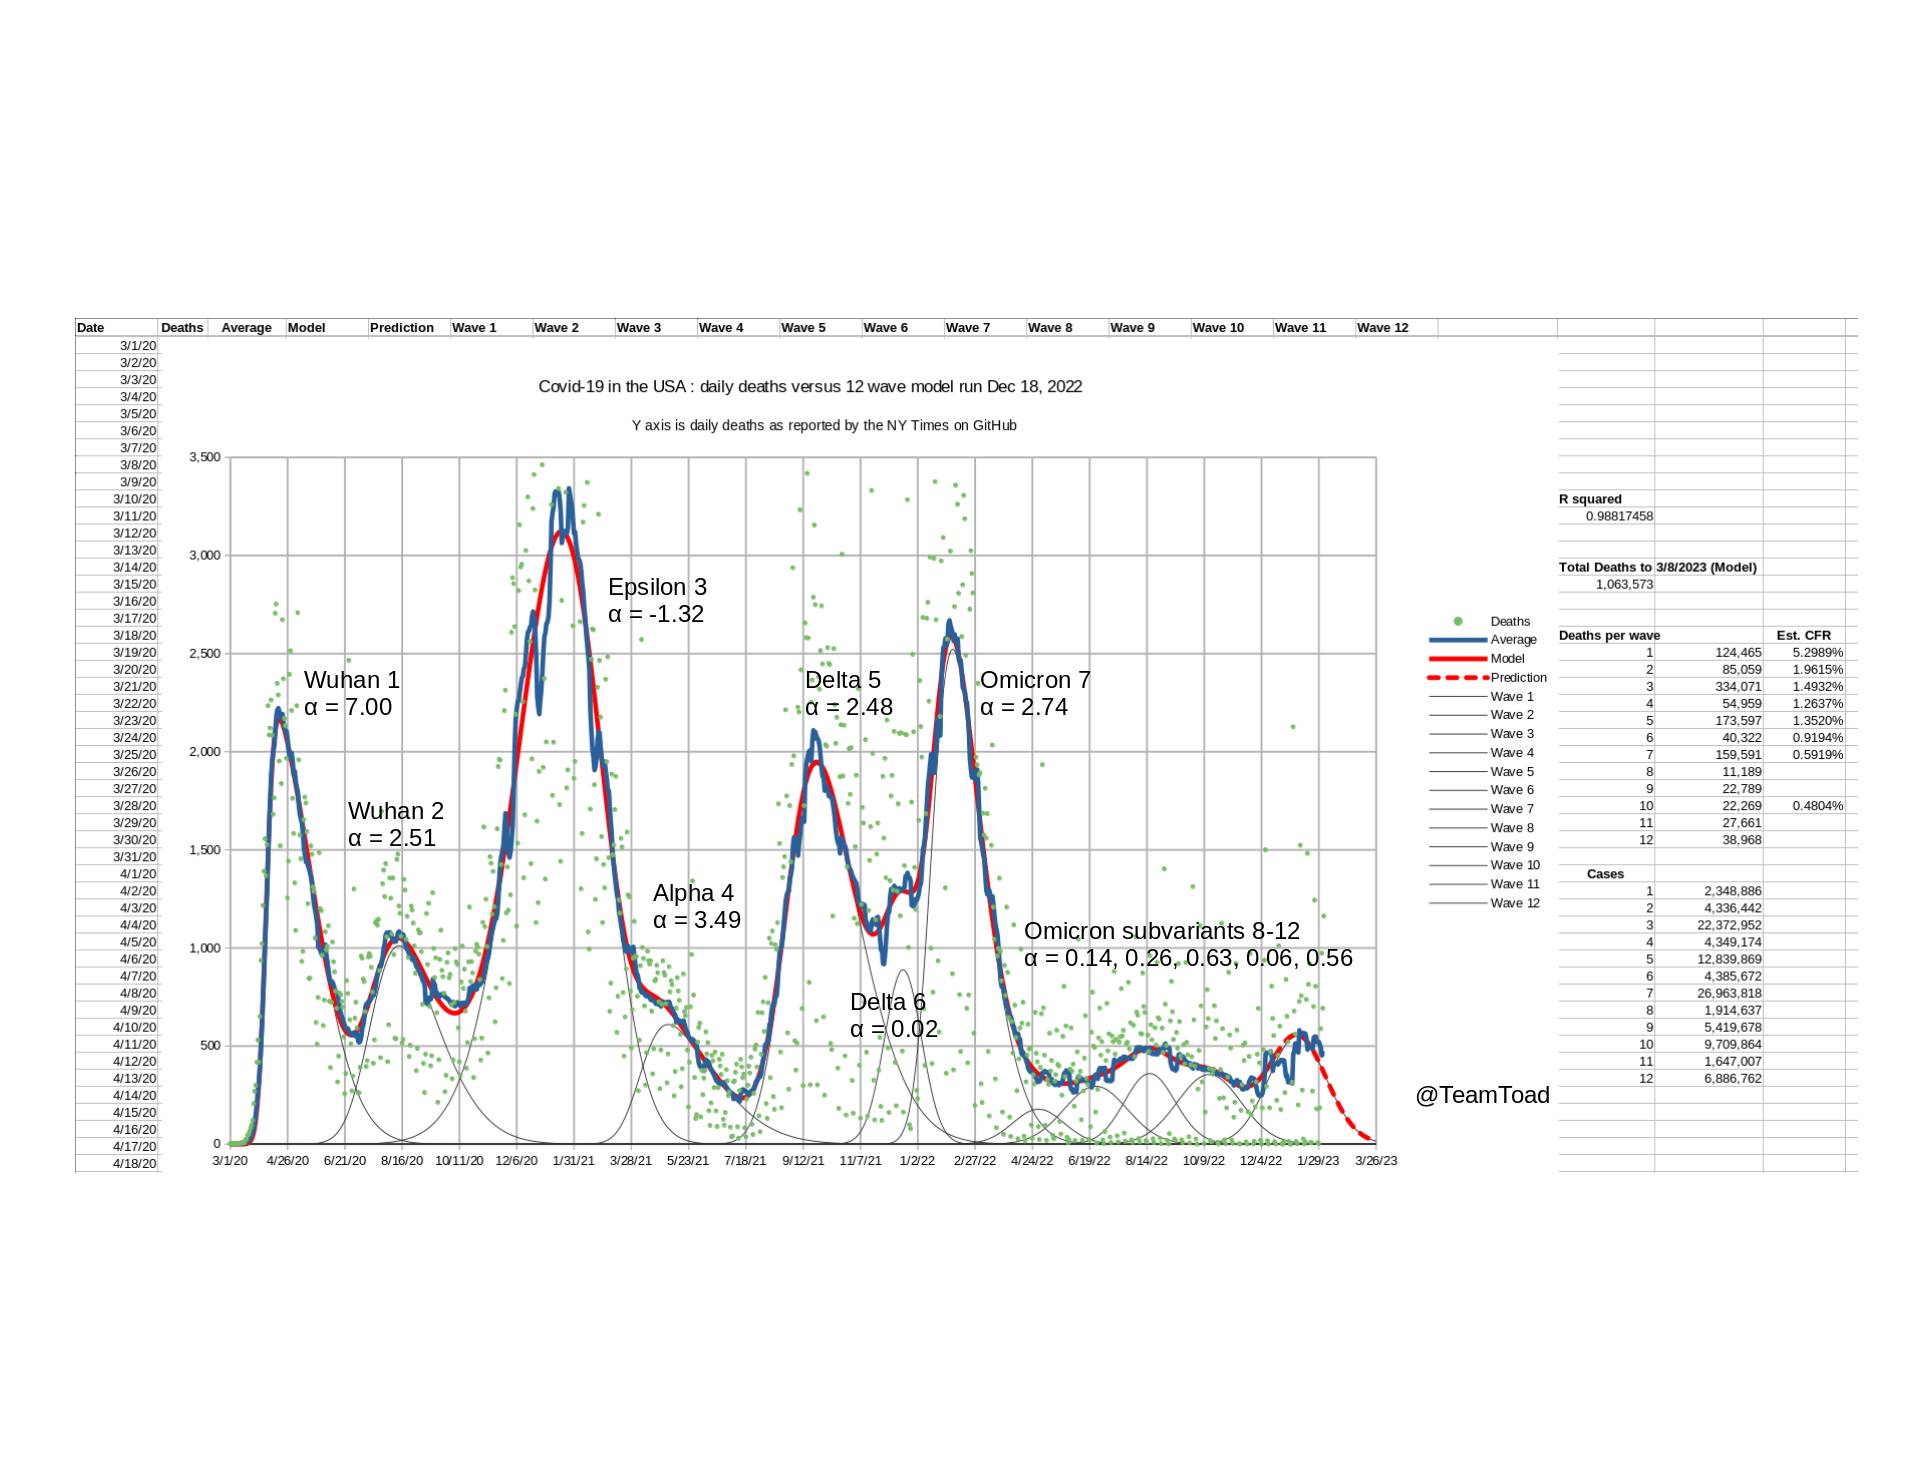
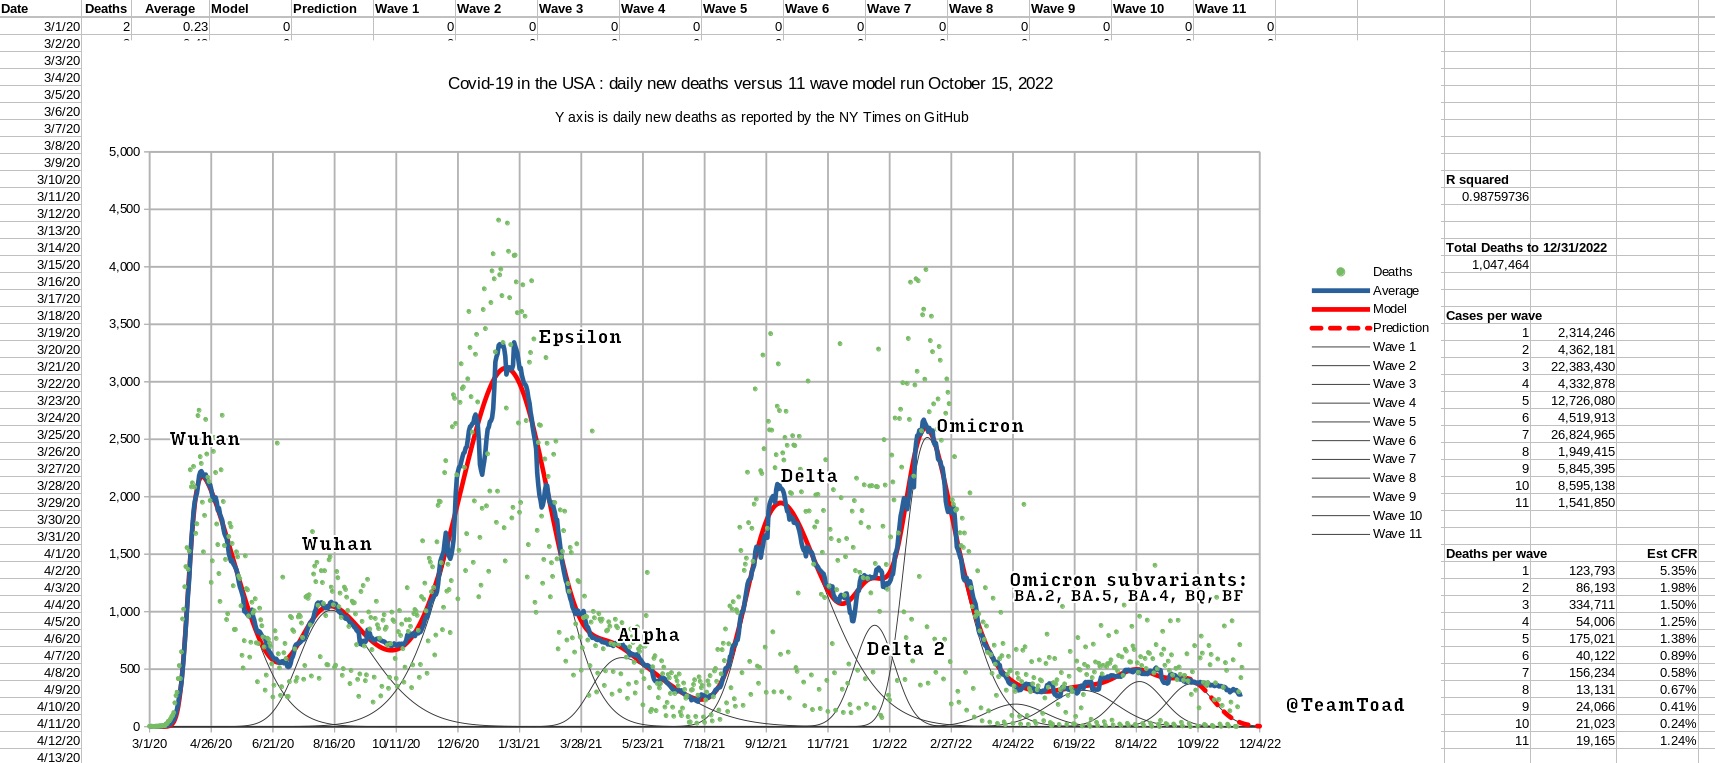
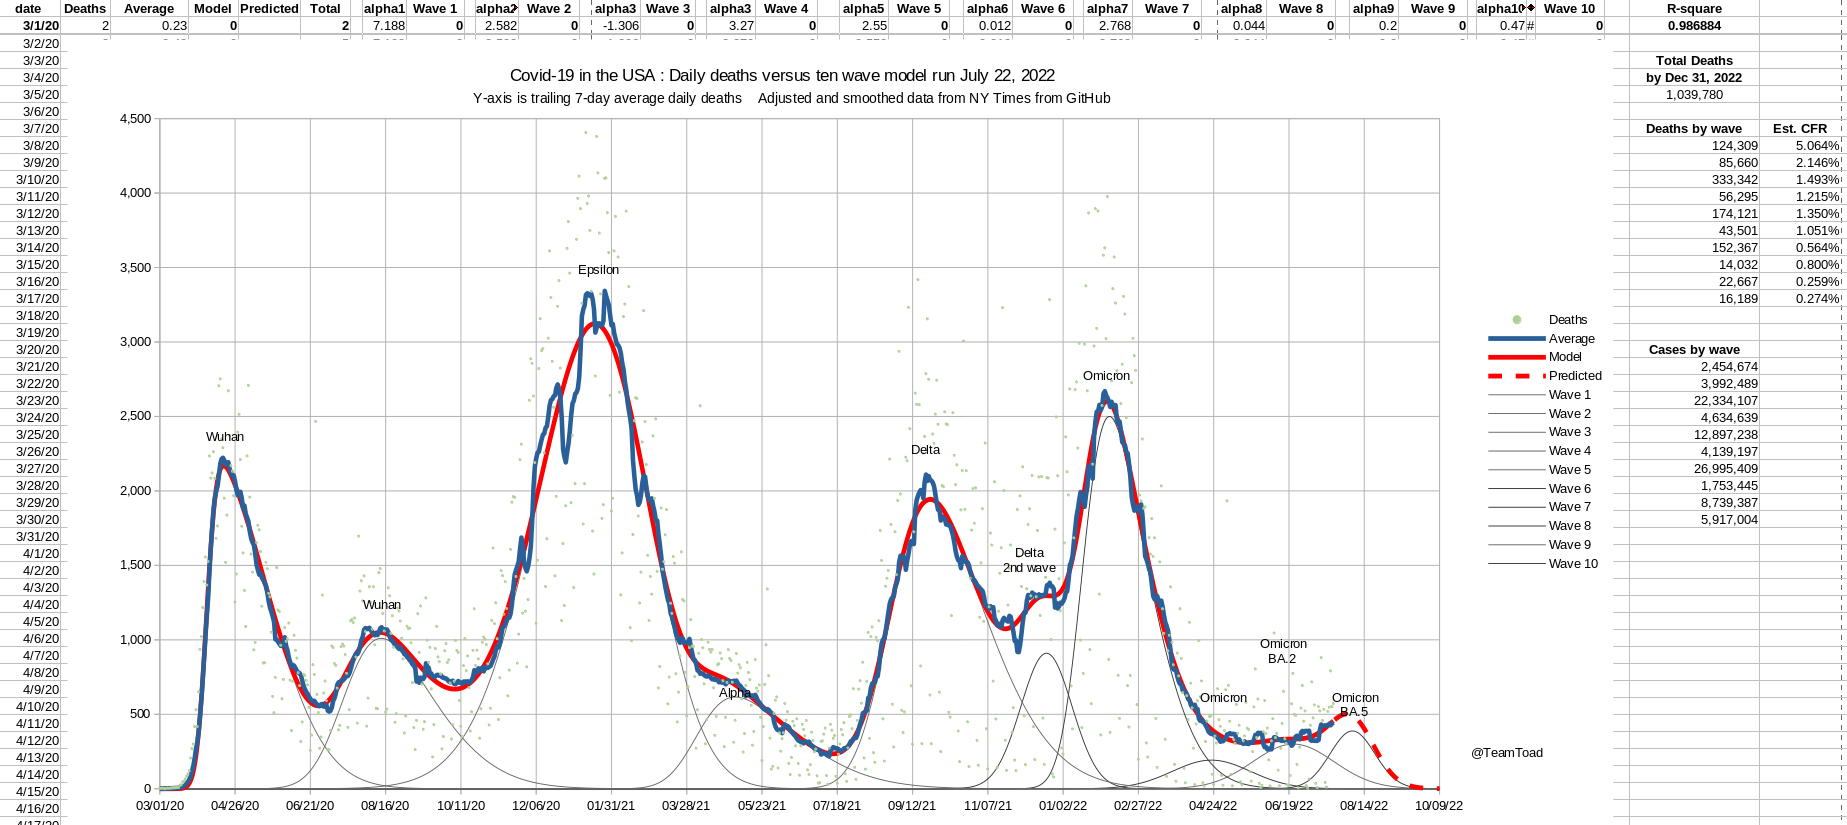
| The estimated case fatality rate (CFR) is 1.262% or roughly one death per 79 confirmed cases. | 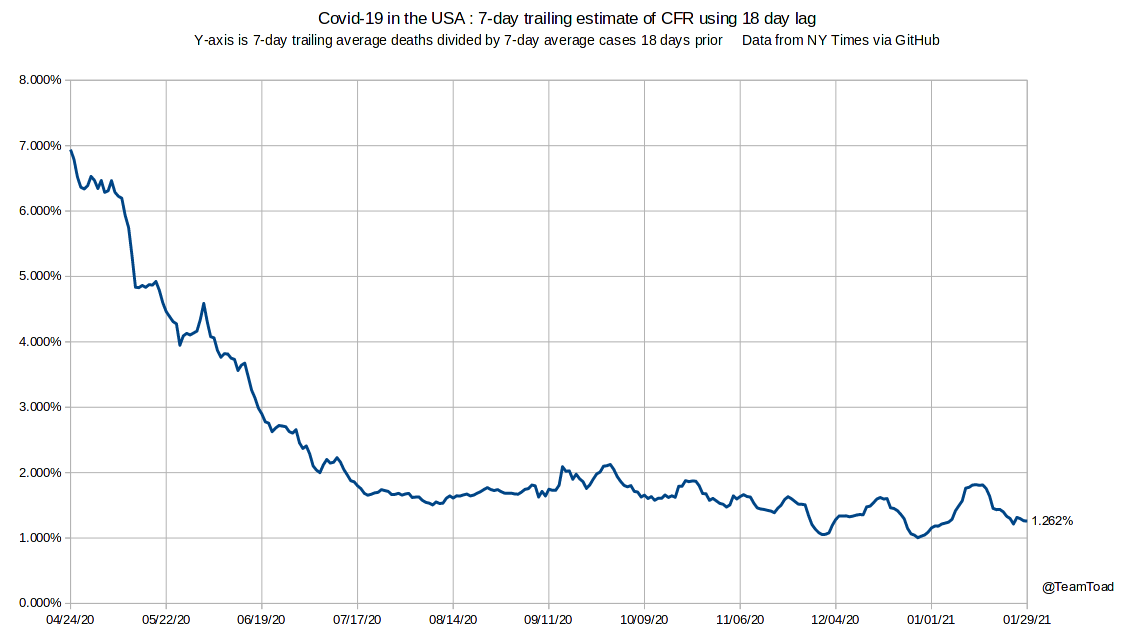
|
 |
 |
|
According to the CDC
vaccine tracker,
13,595,803 have received 1 or 2 doses of one of the two vaccines as of Jan 19, 2021.
Included in that 13.6M are 2,023,124 people who have received both doses. Going forward, I expect the vaccinations to significantly reduce the total number of cases and deaths below models from Christmas and last week. |
as of January 20, 2021 at 9am CDT 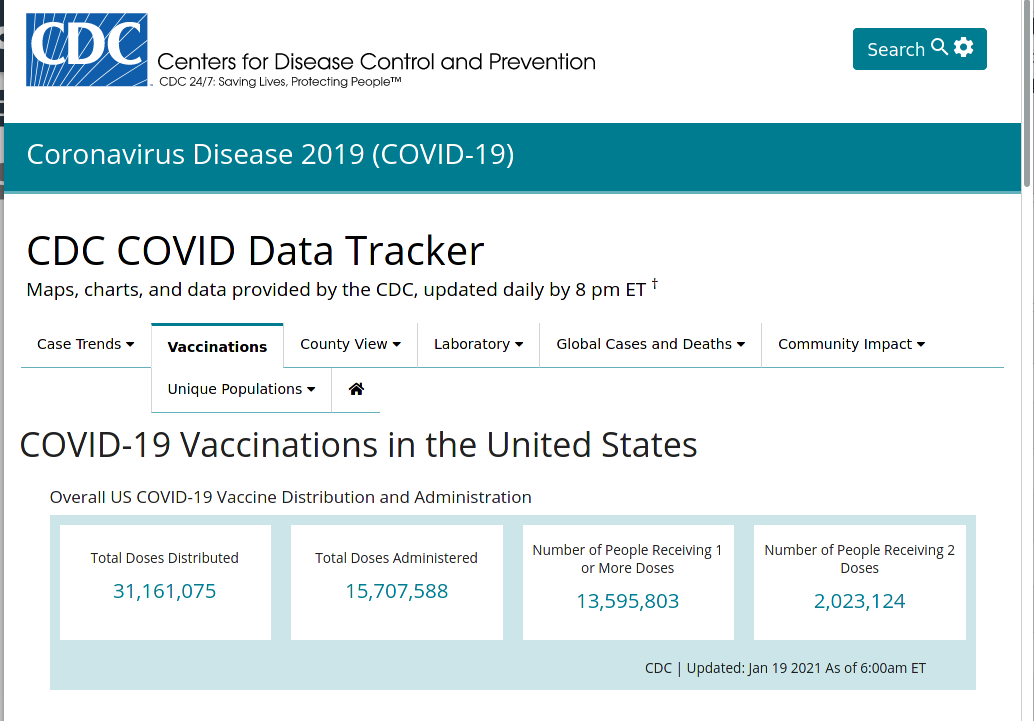
|
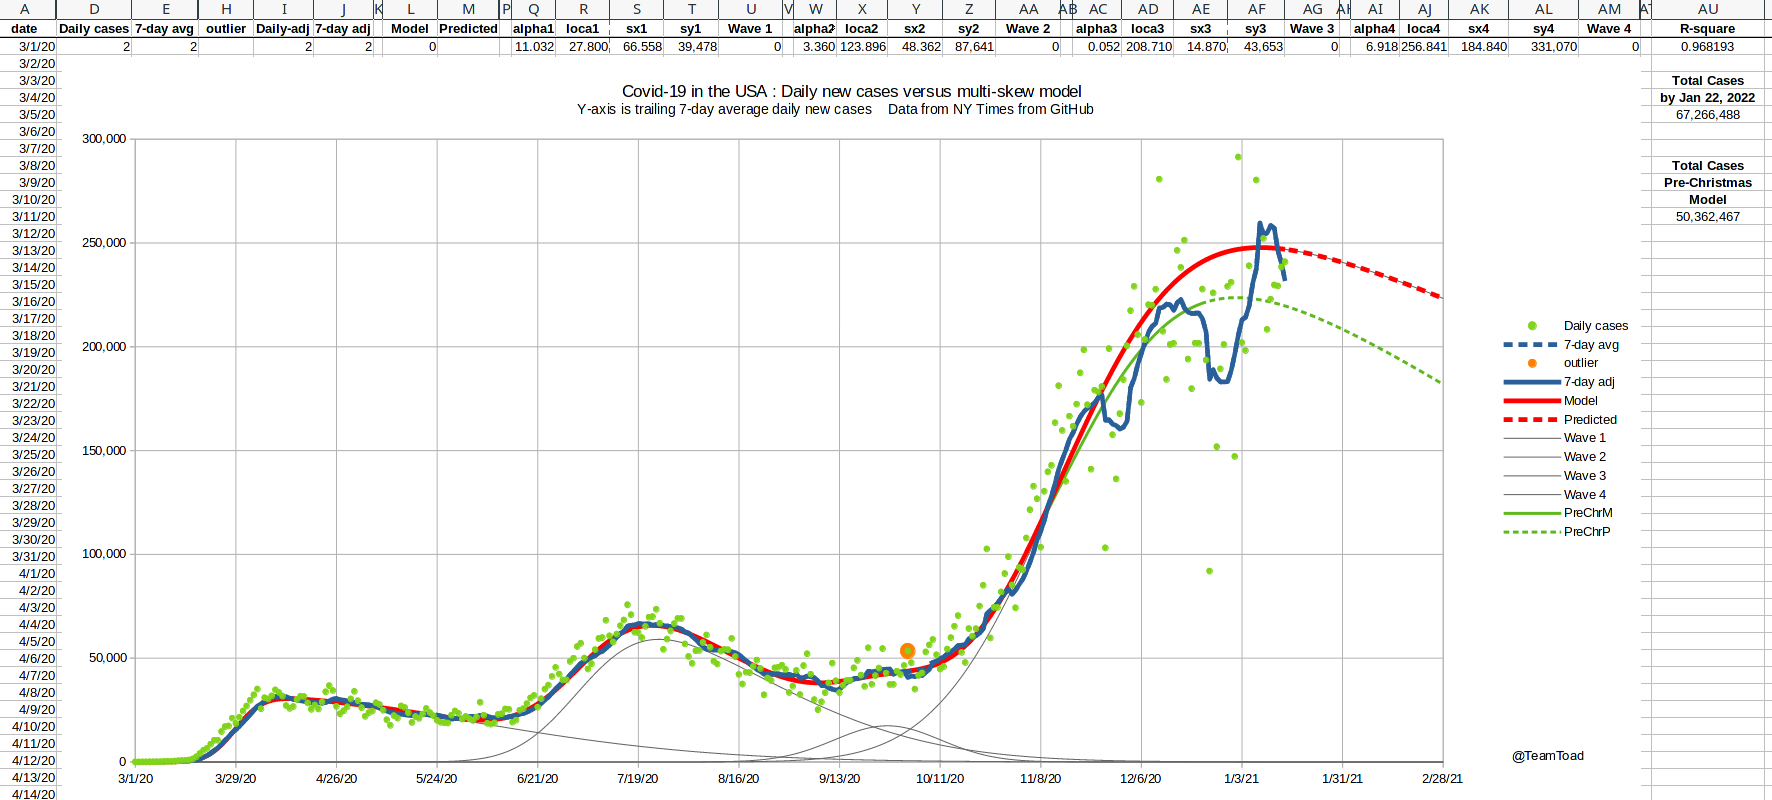 |
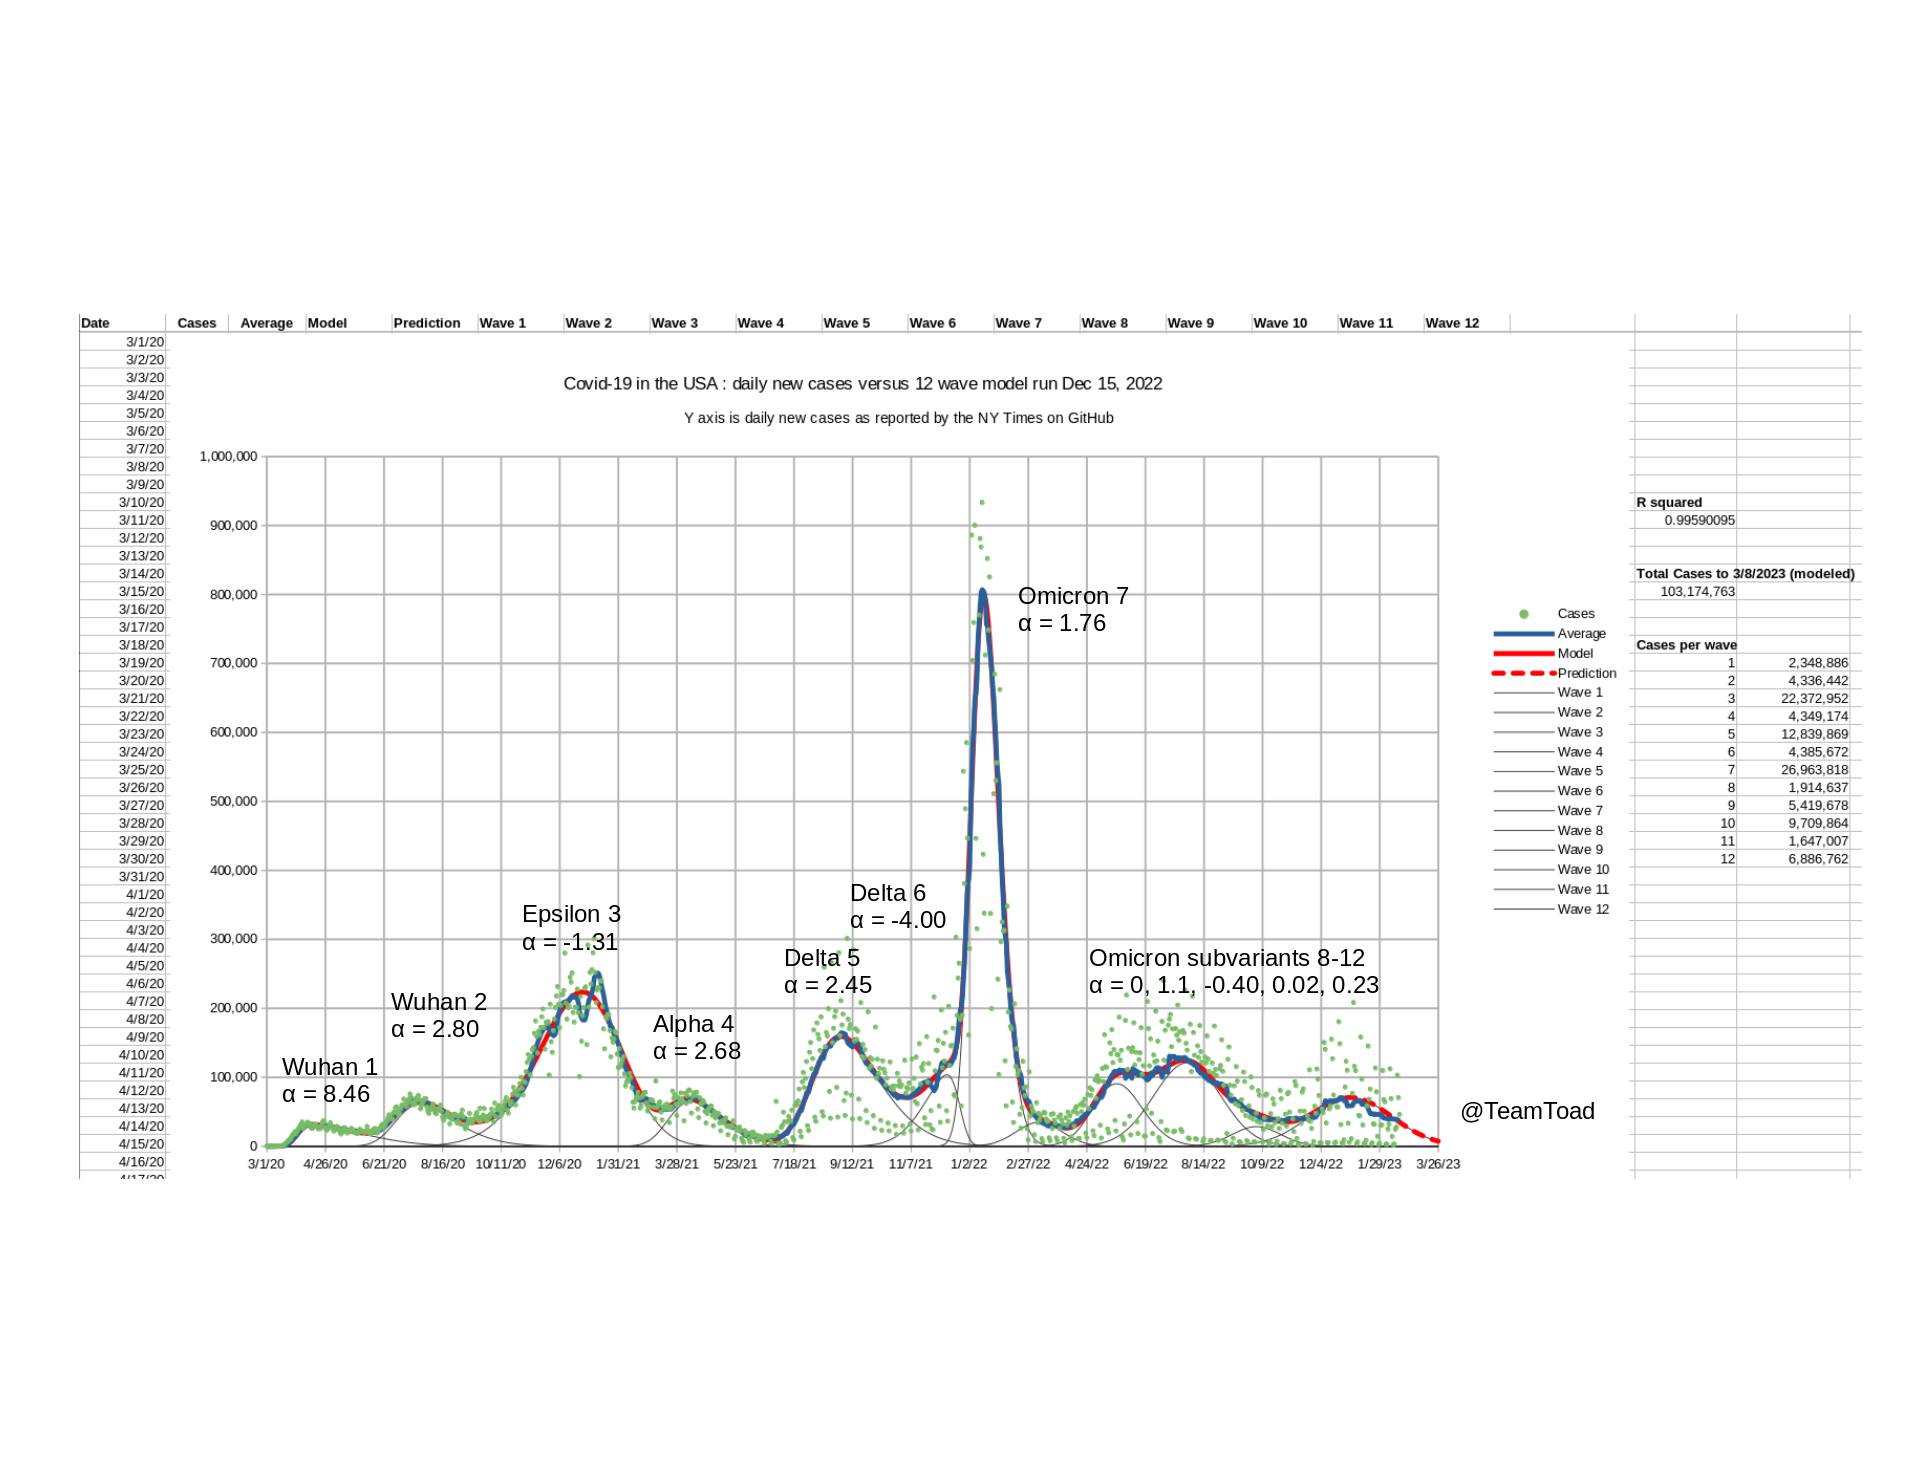
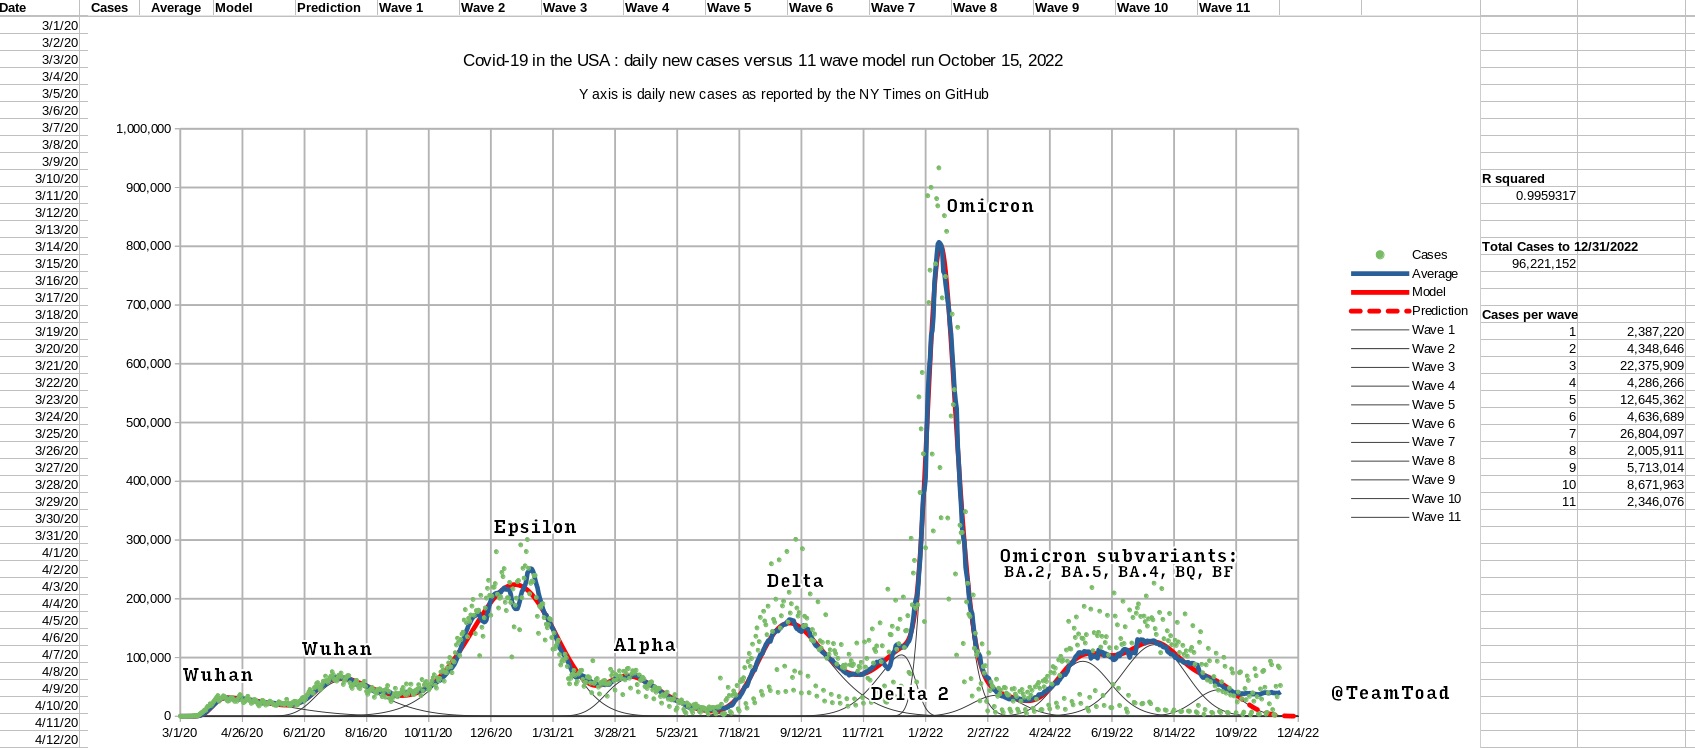
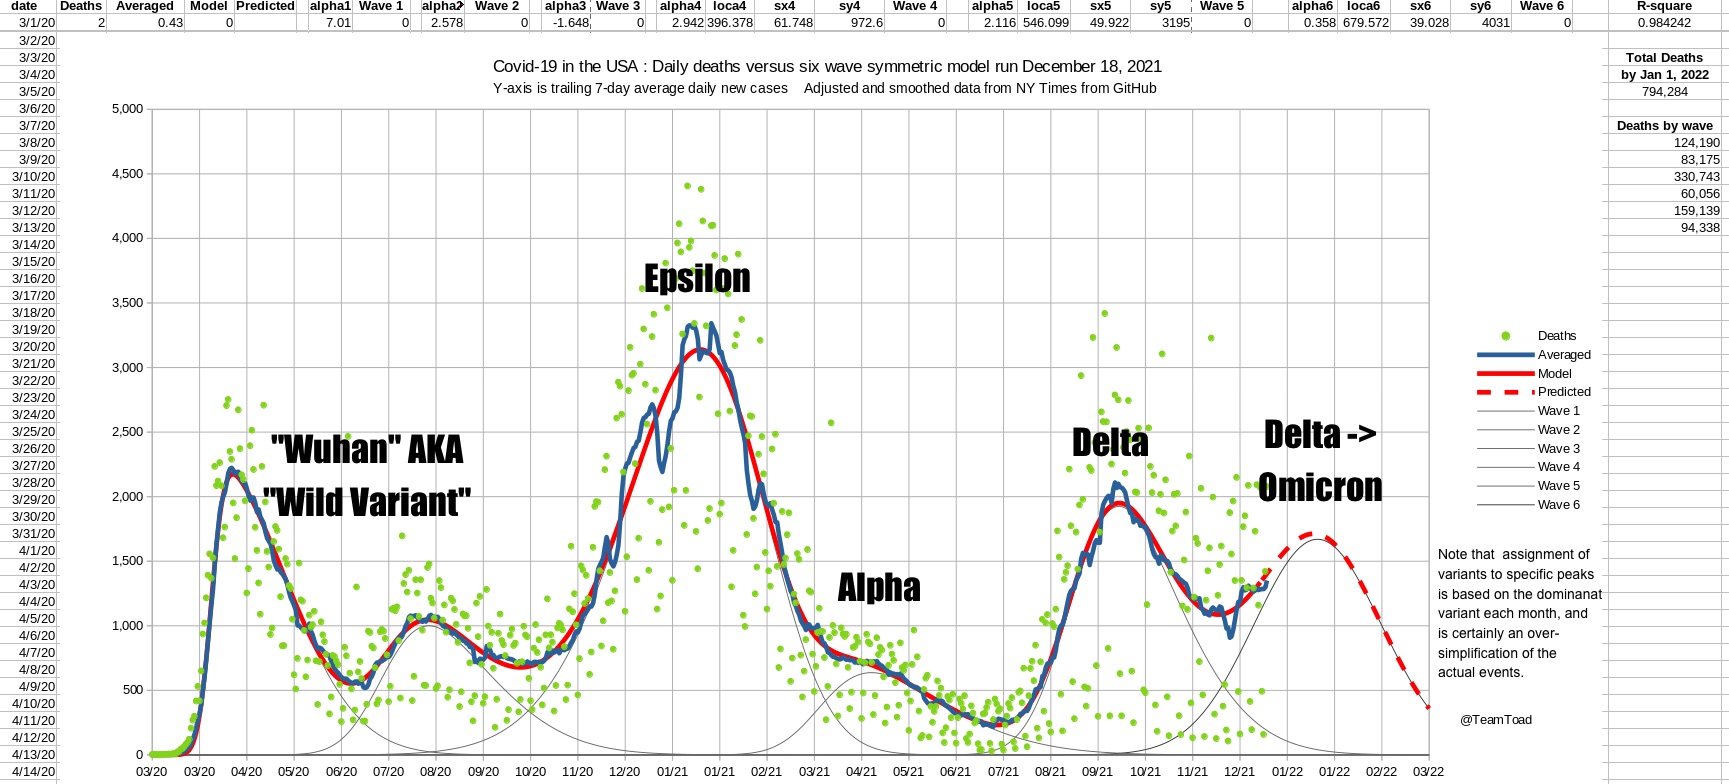
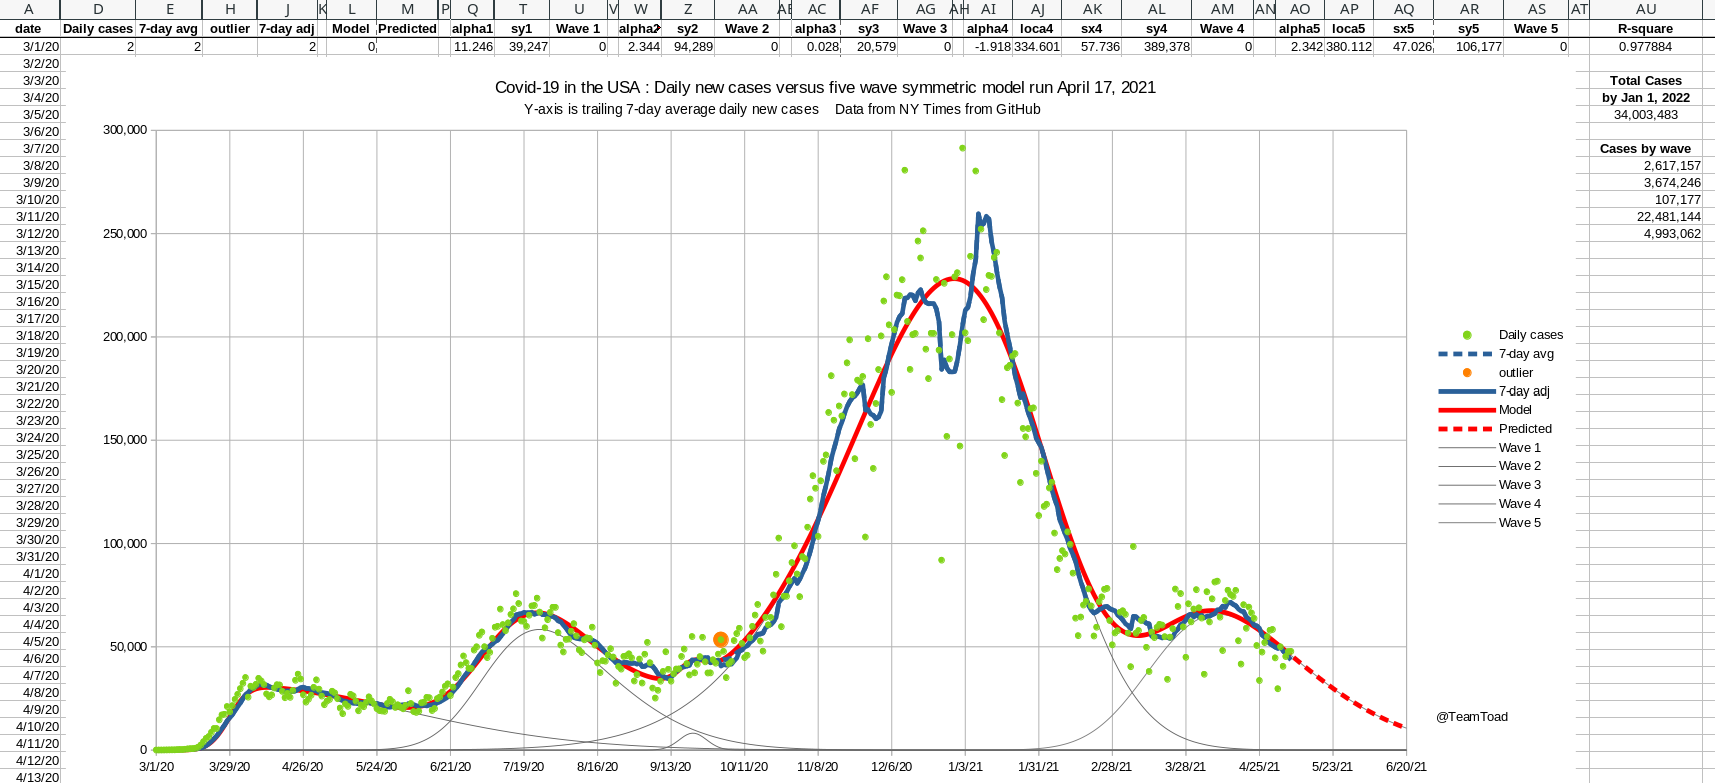
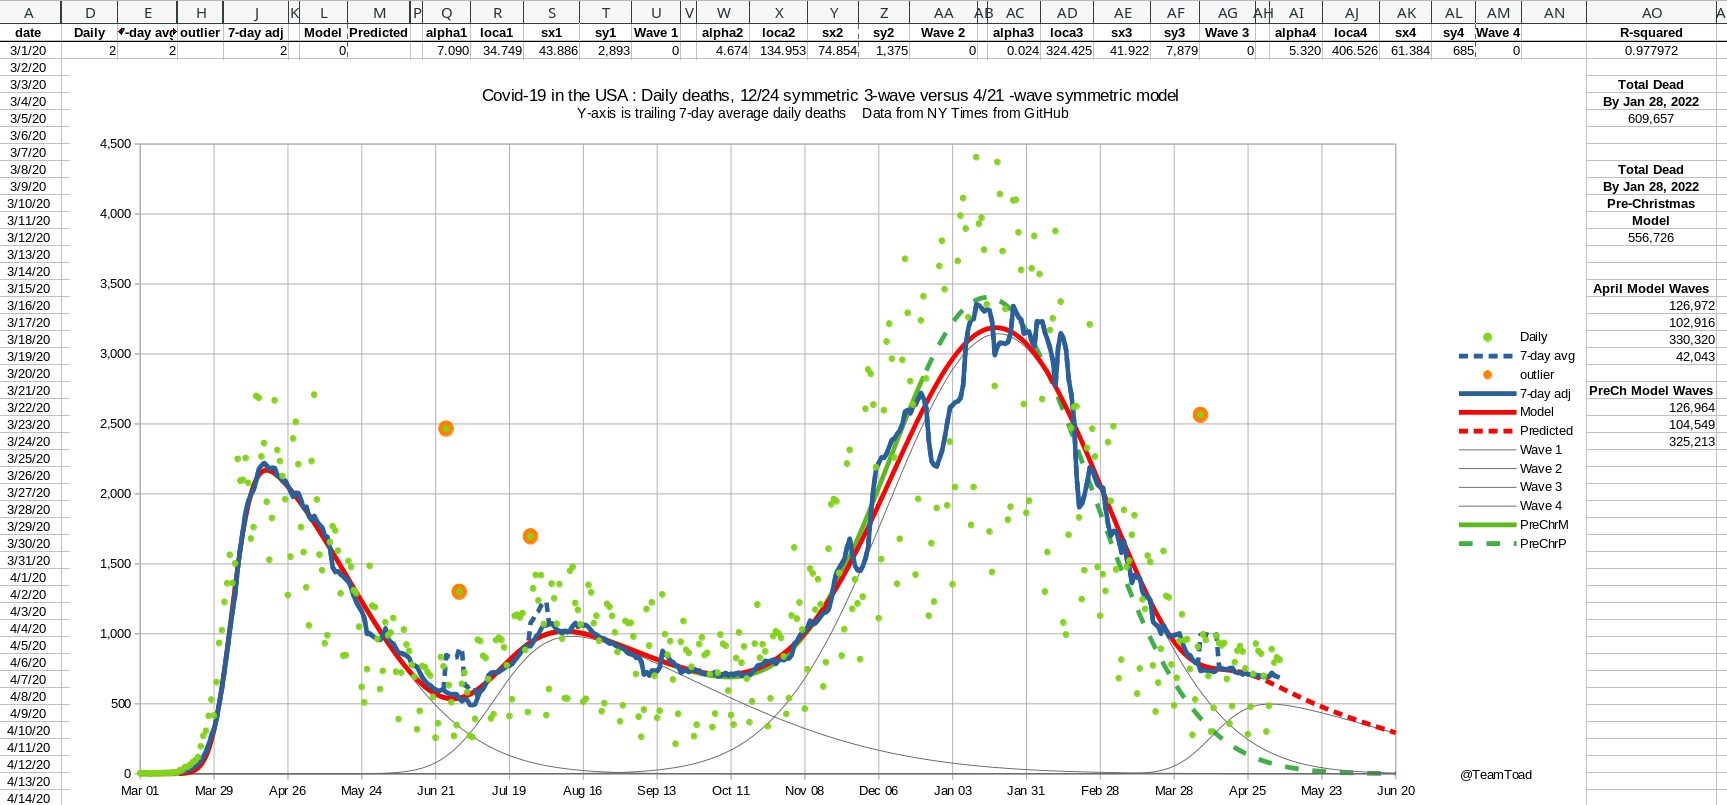
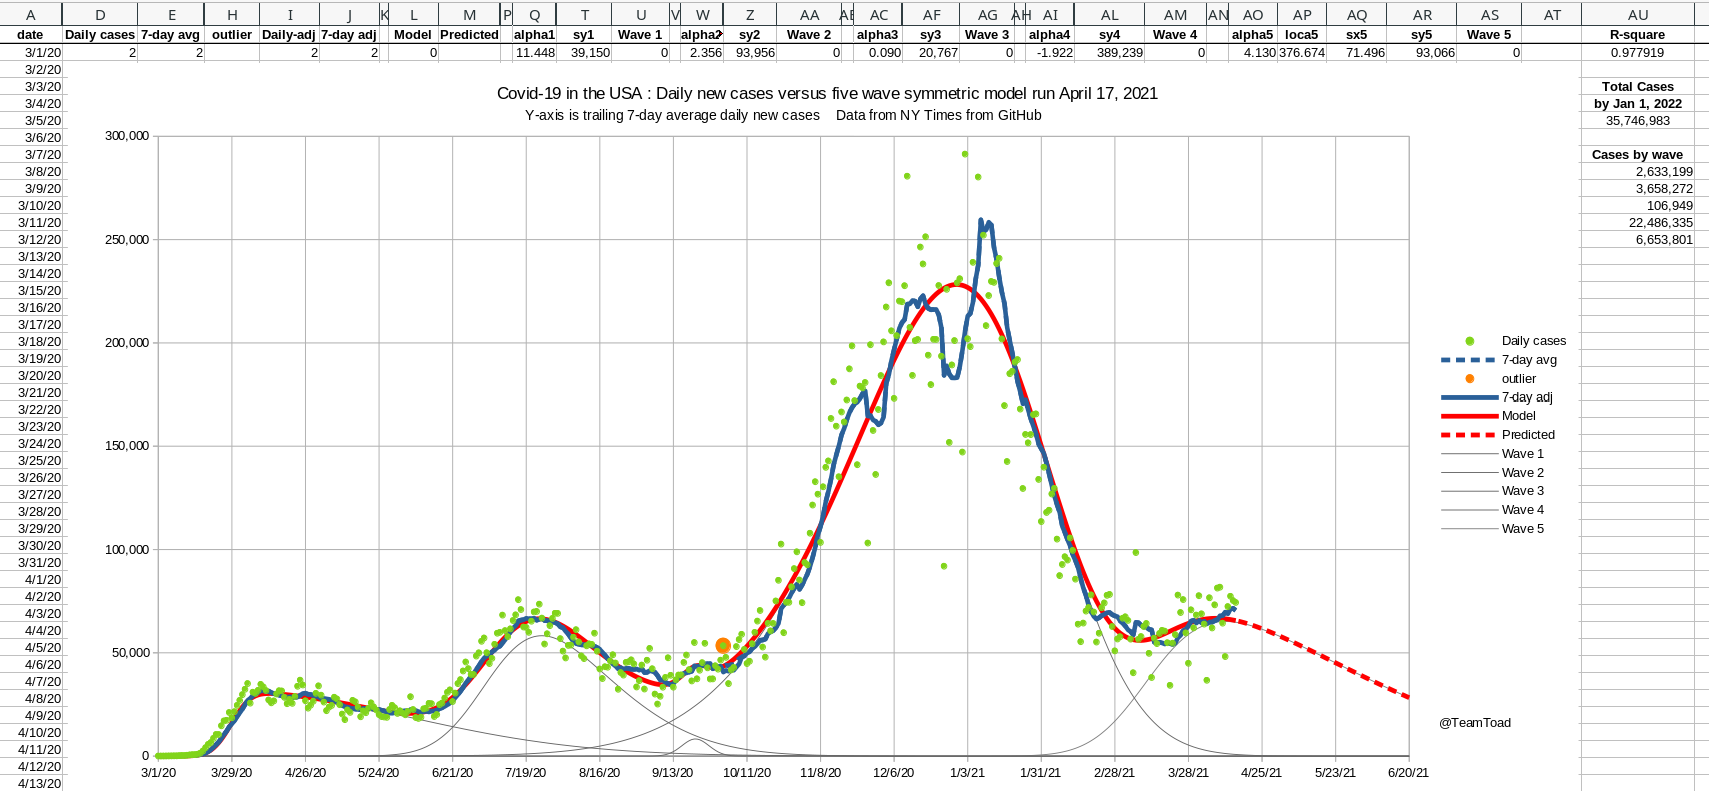
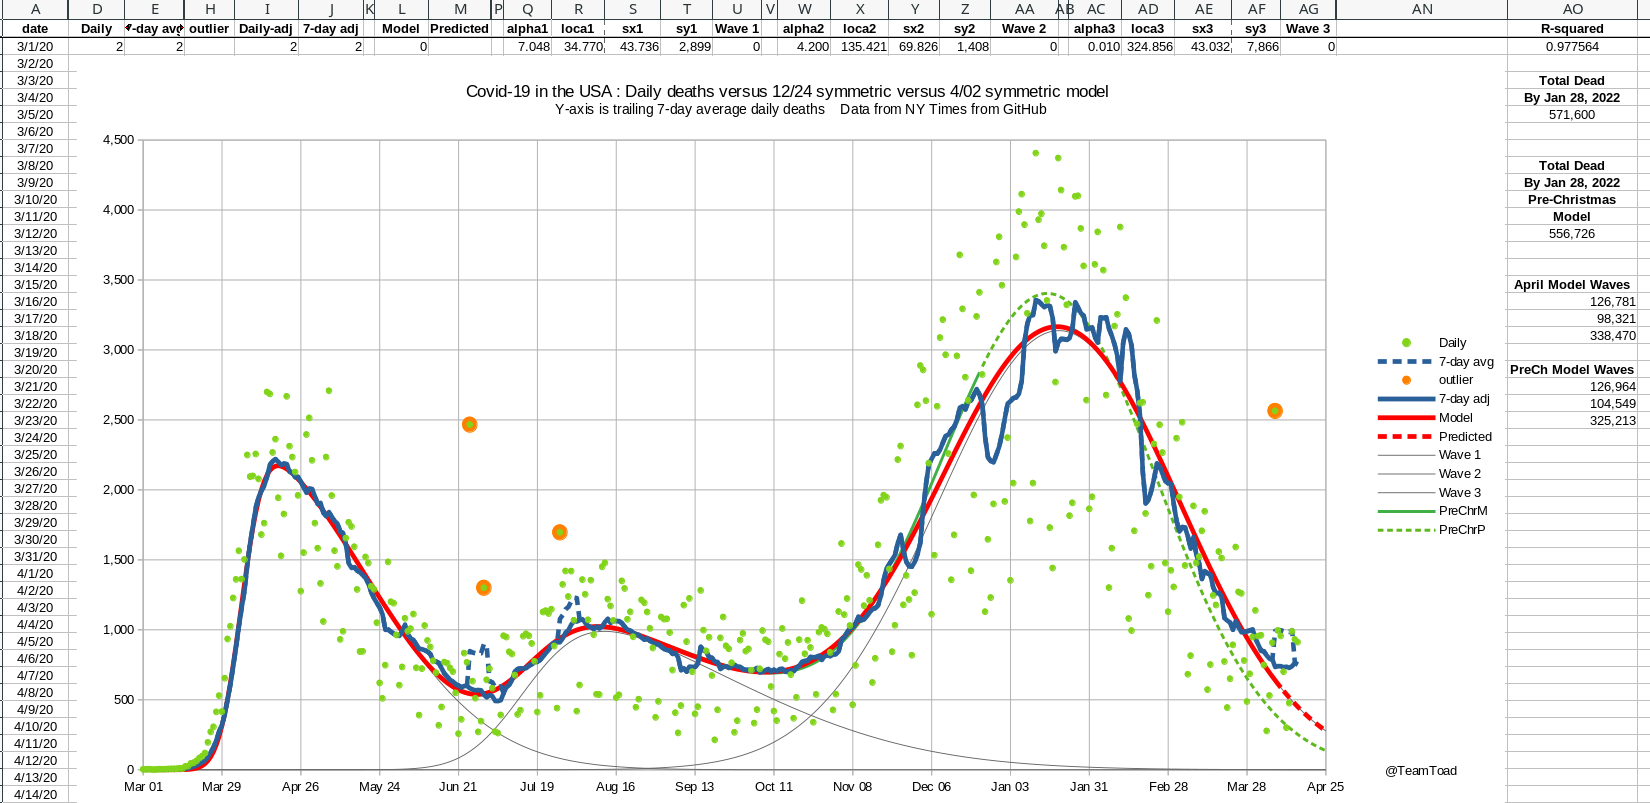
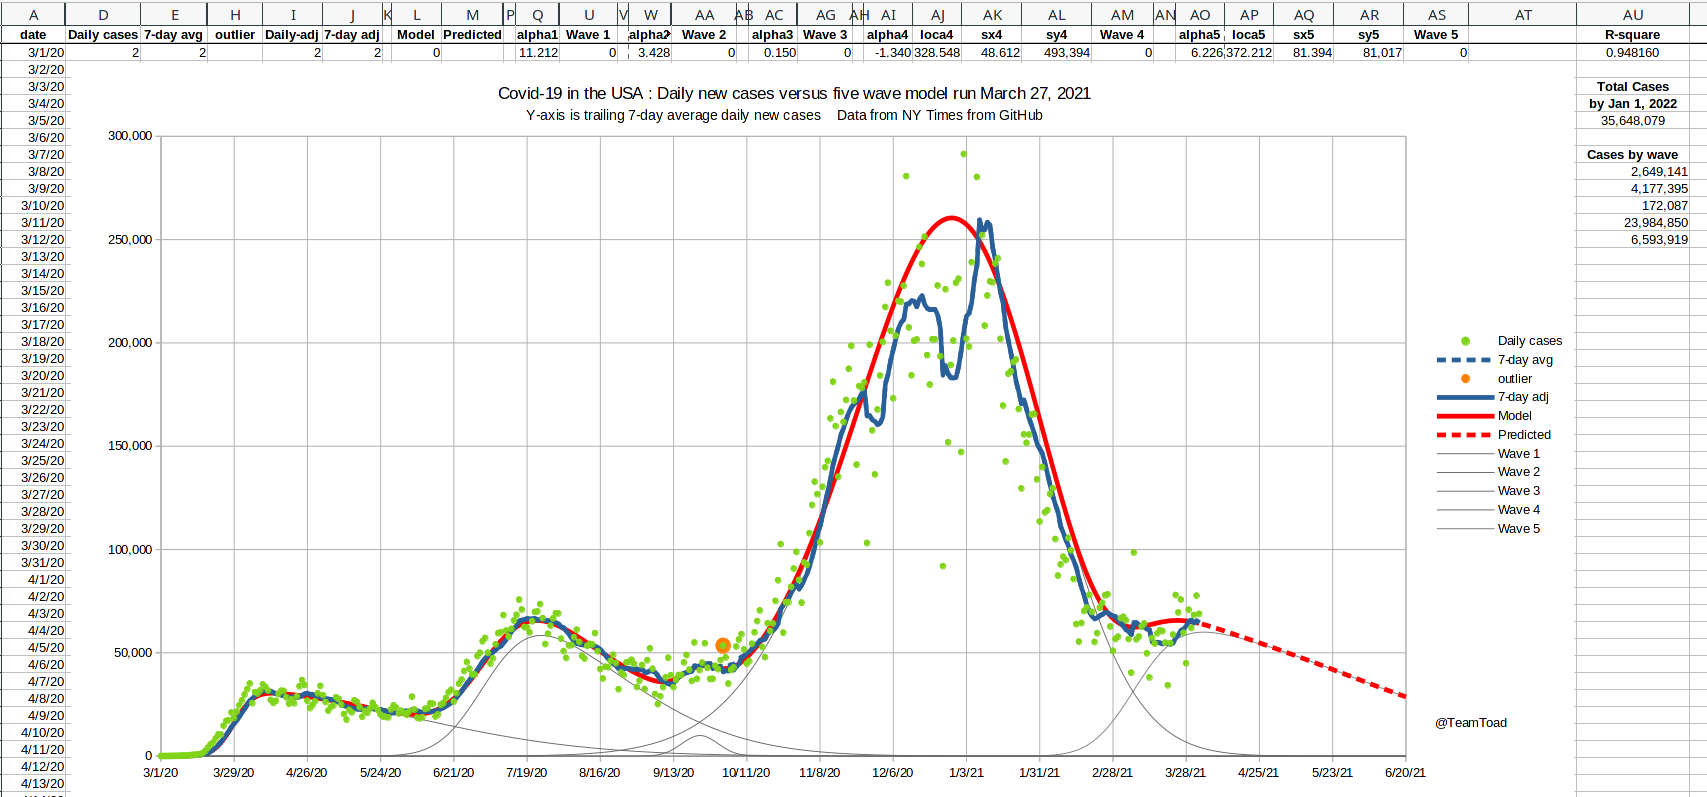
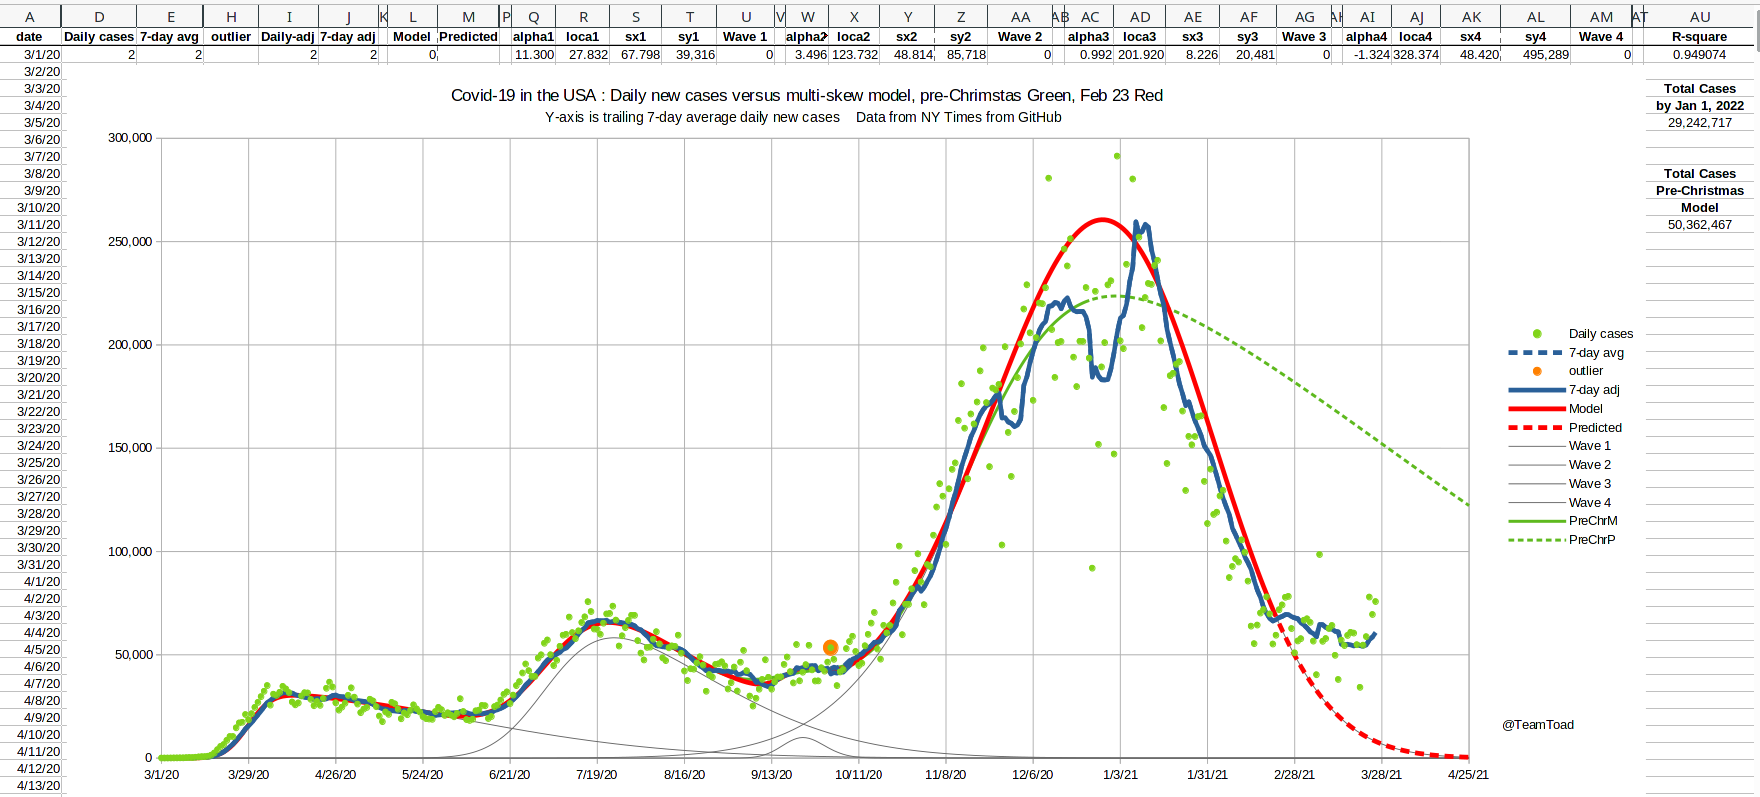
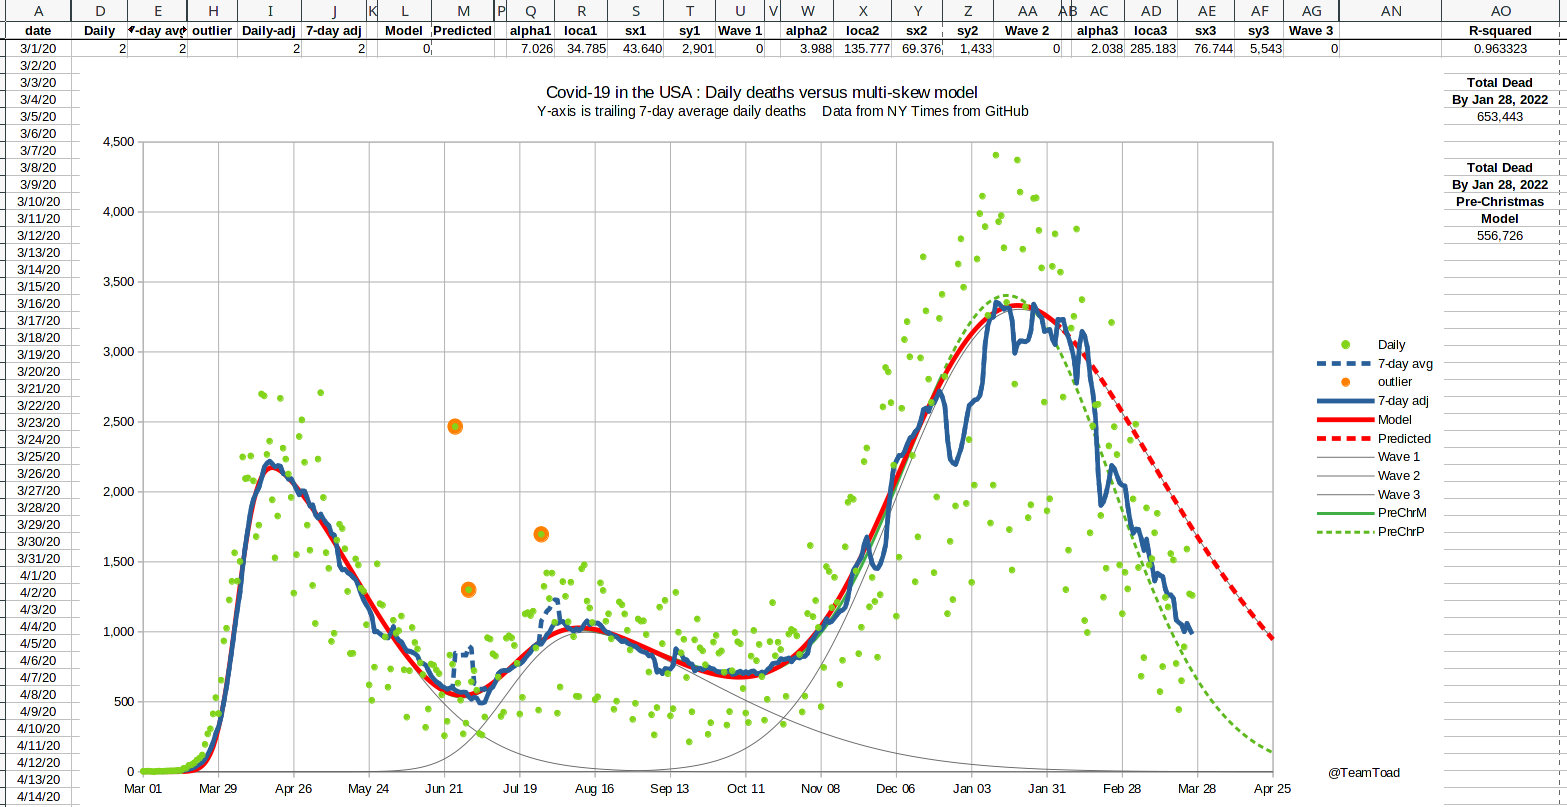
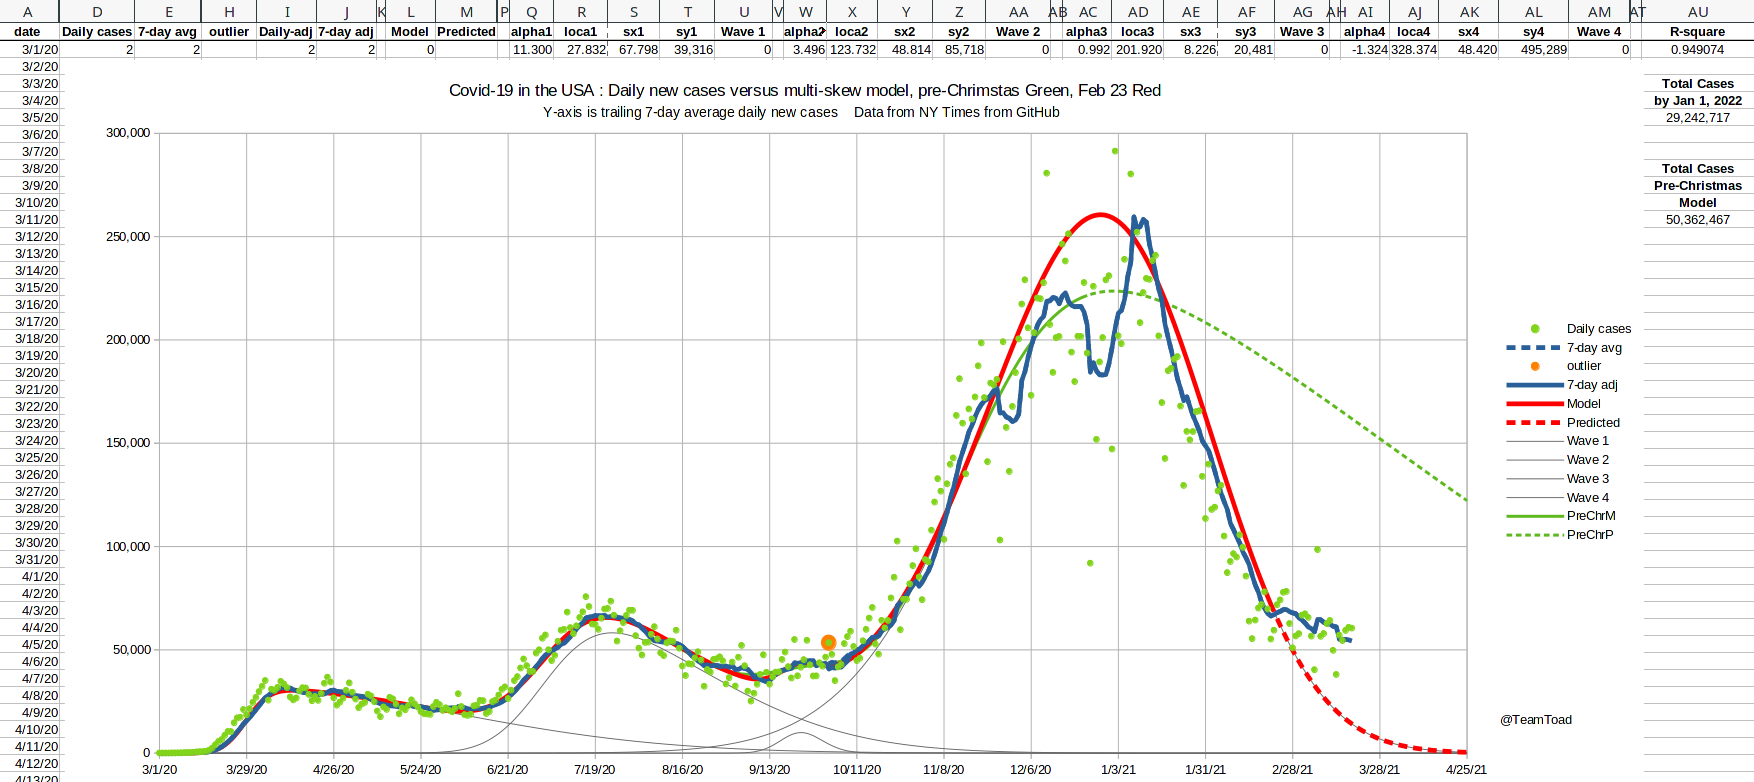
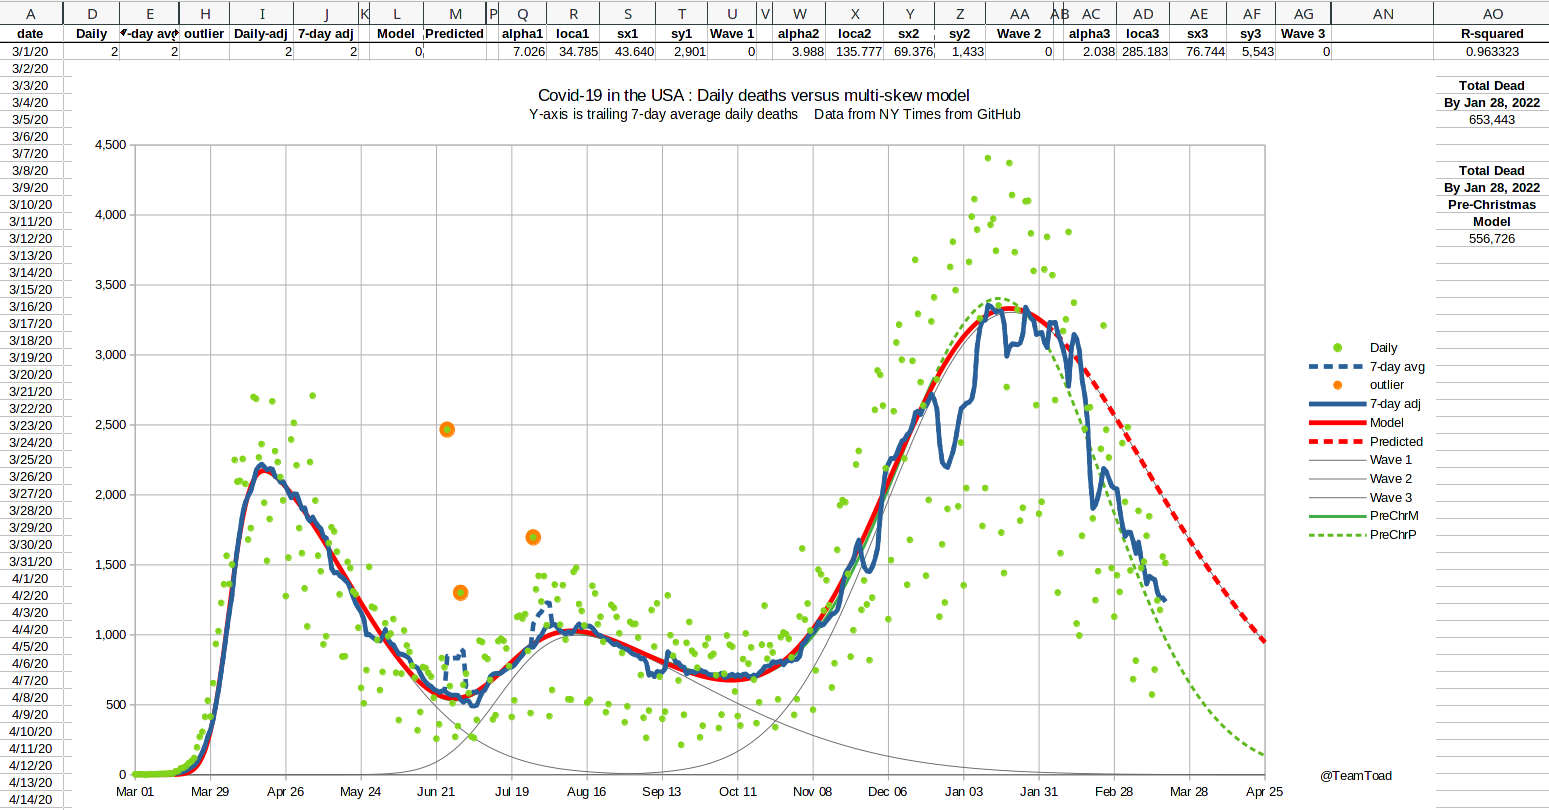
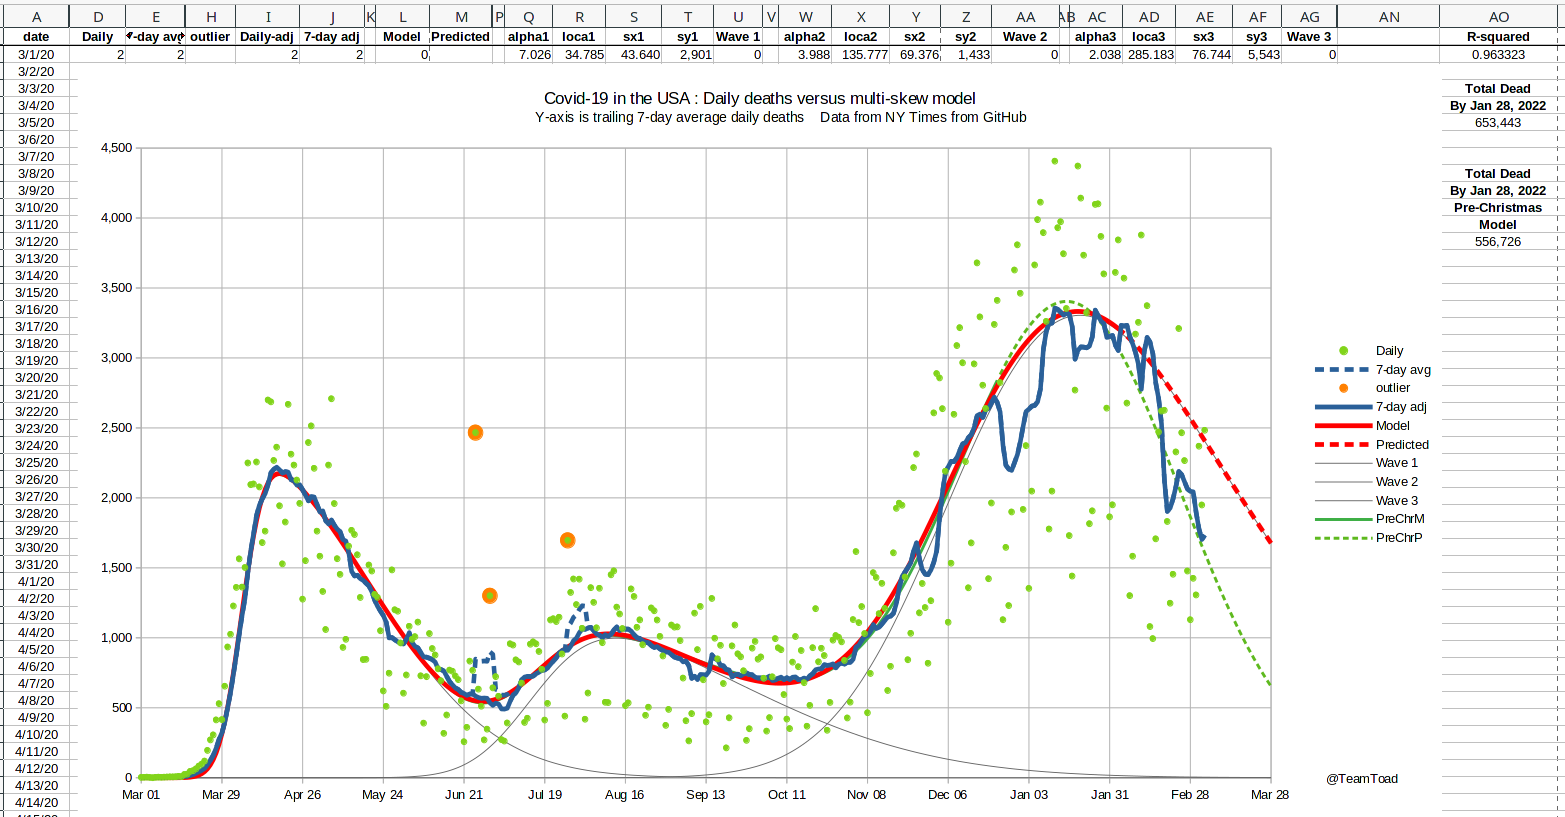
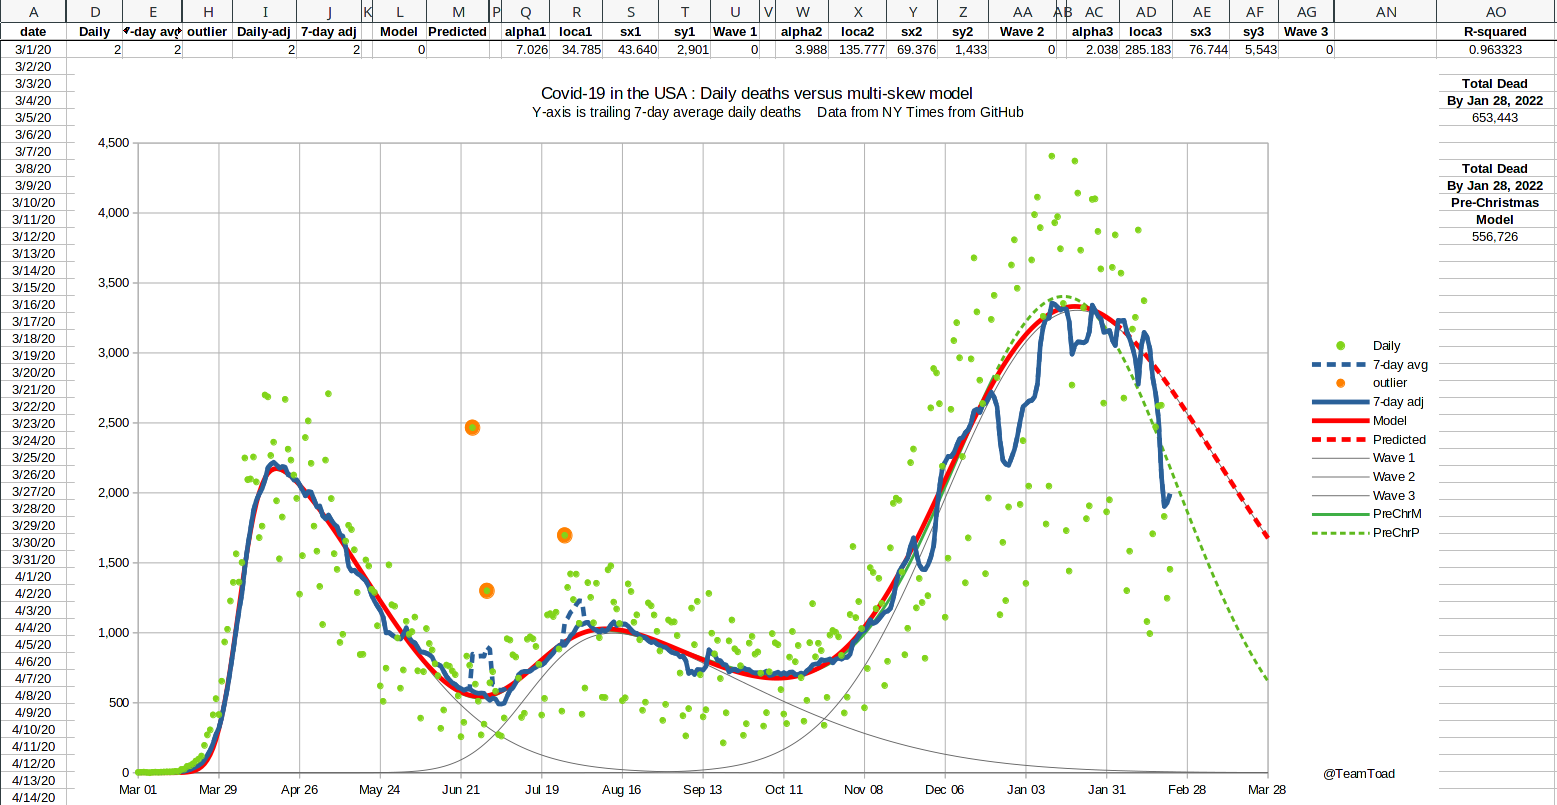
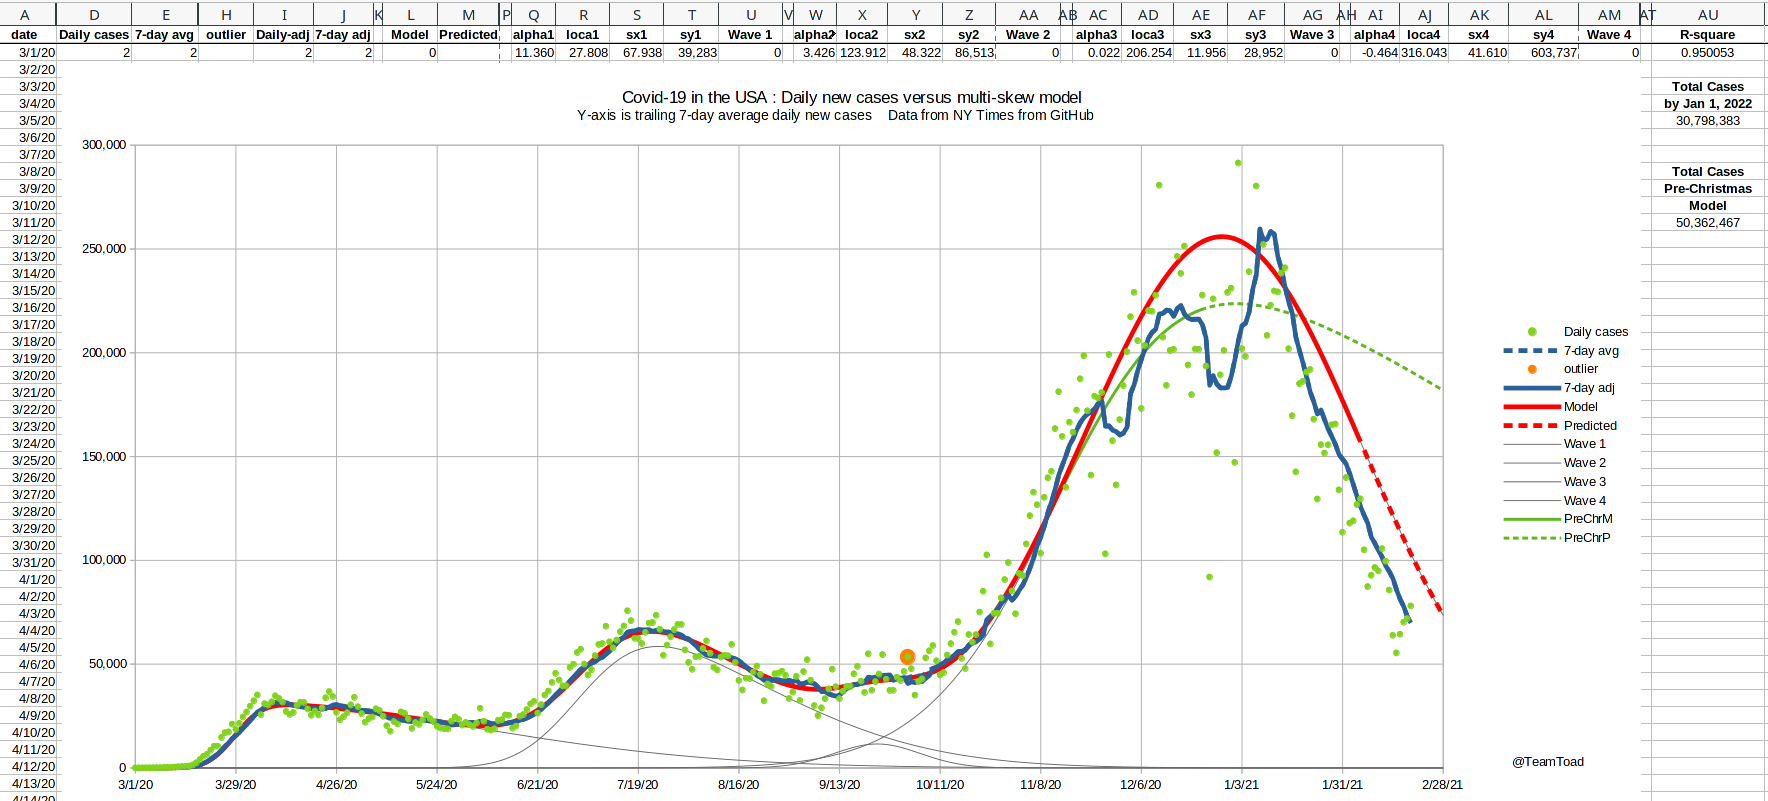
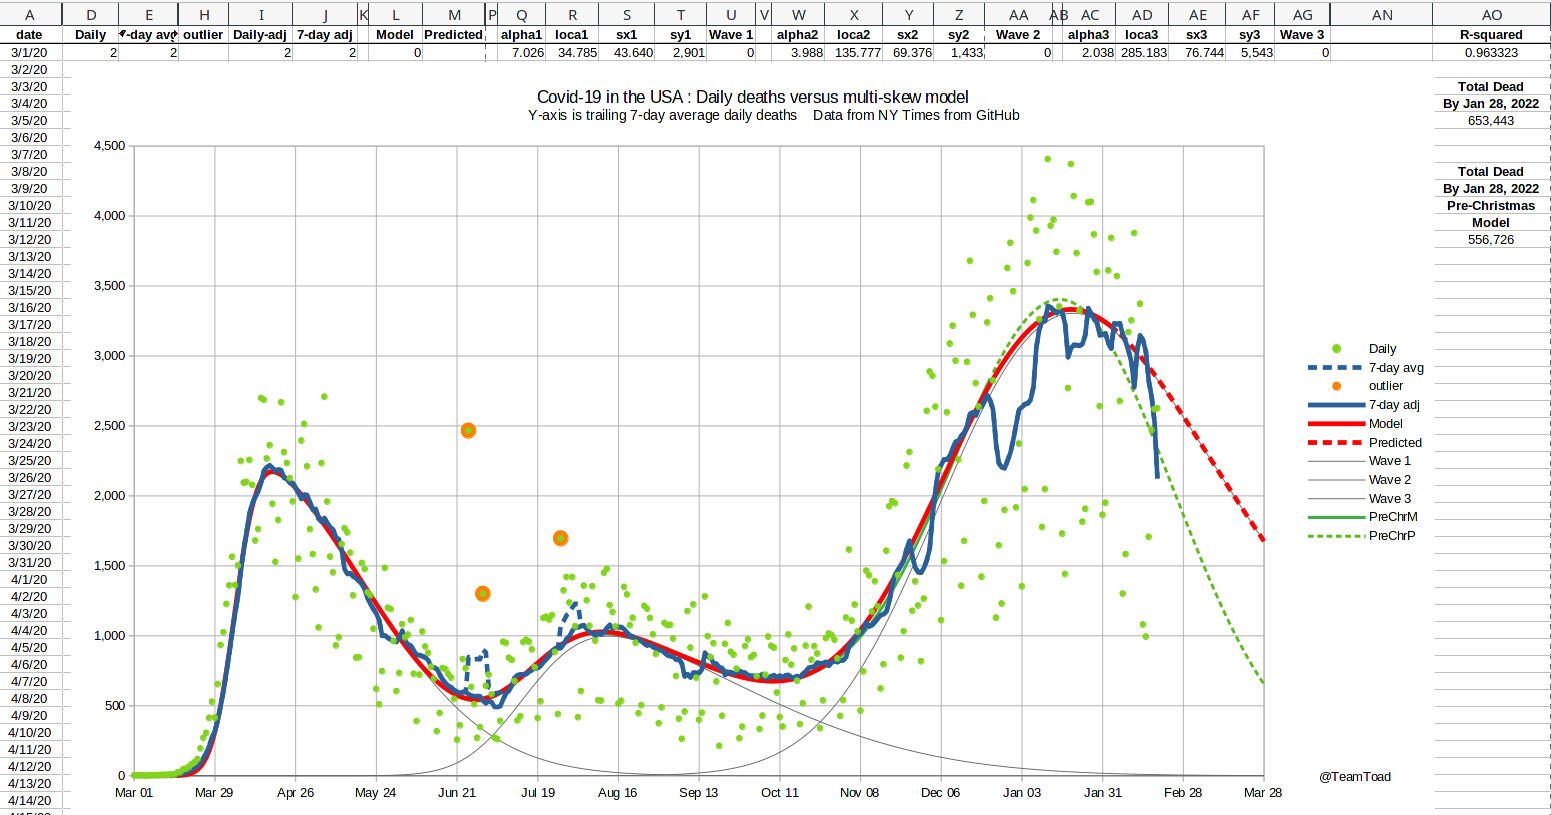
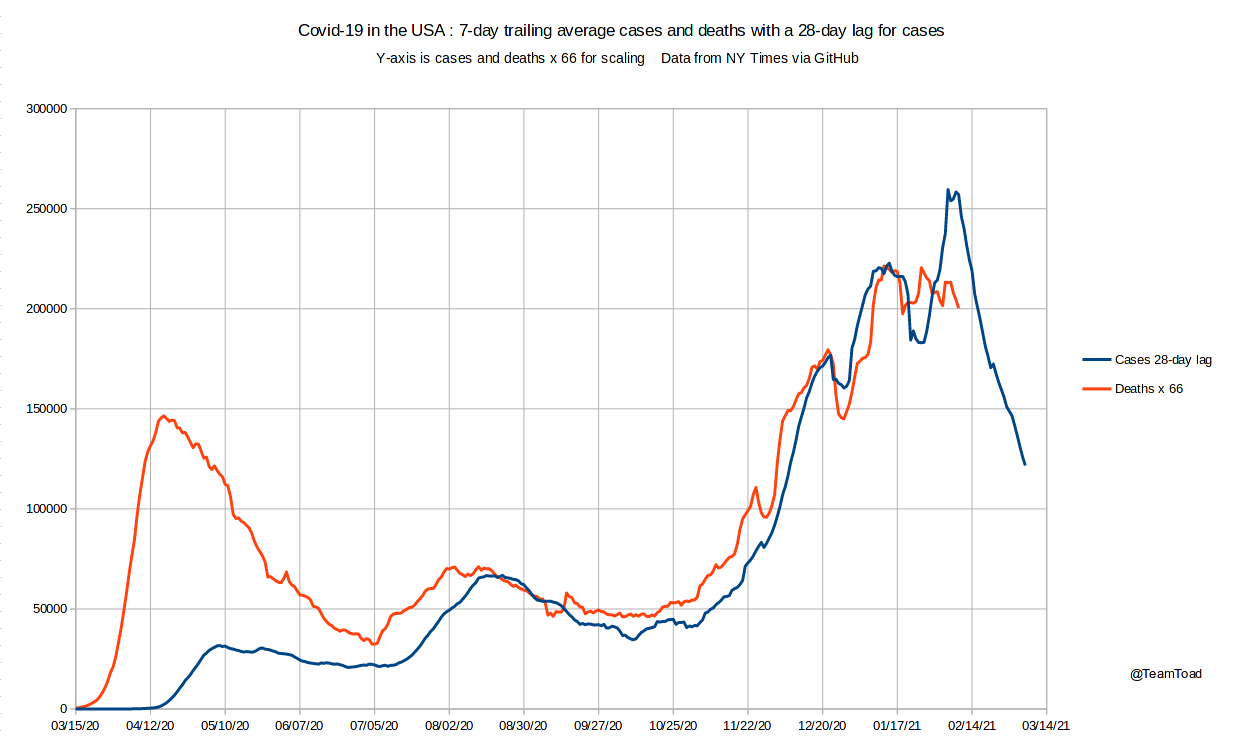
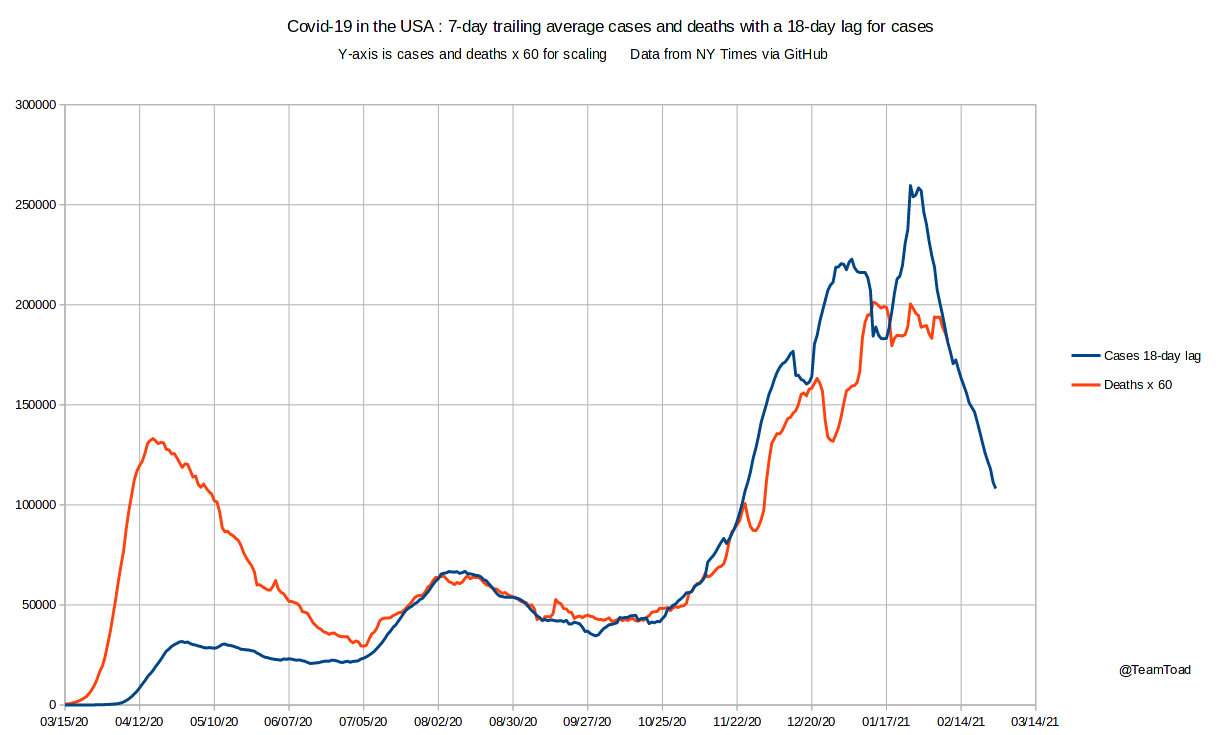
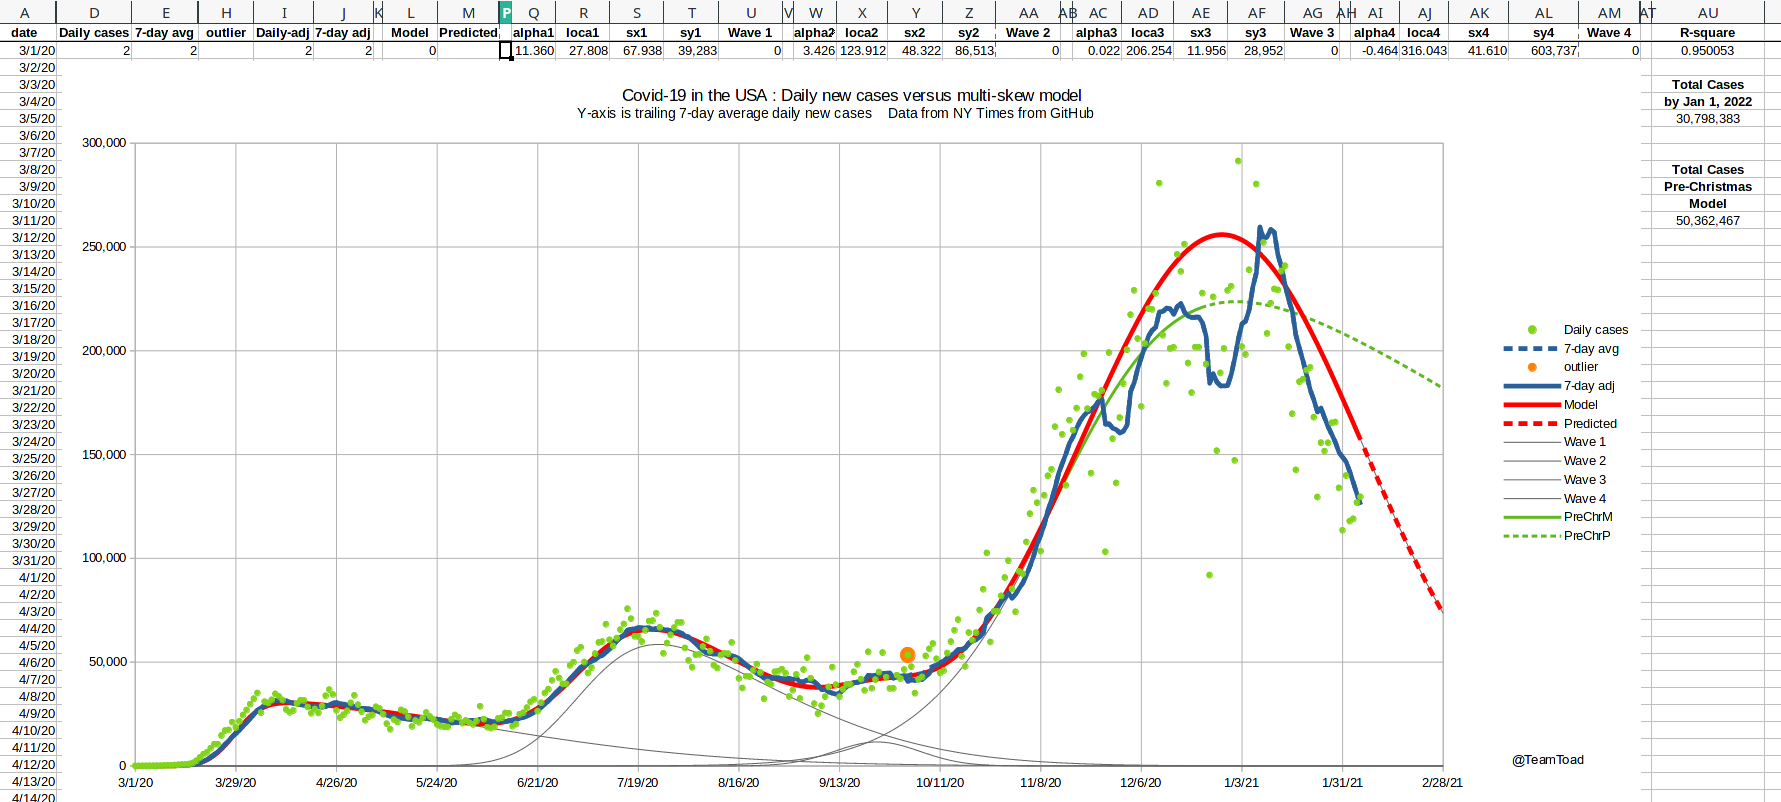
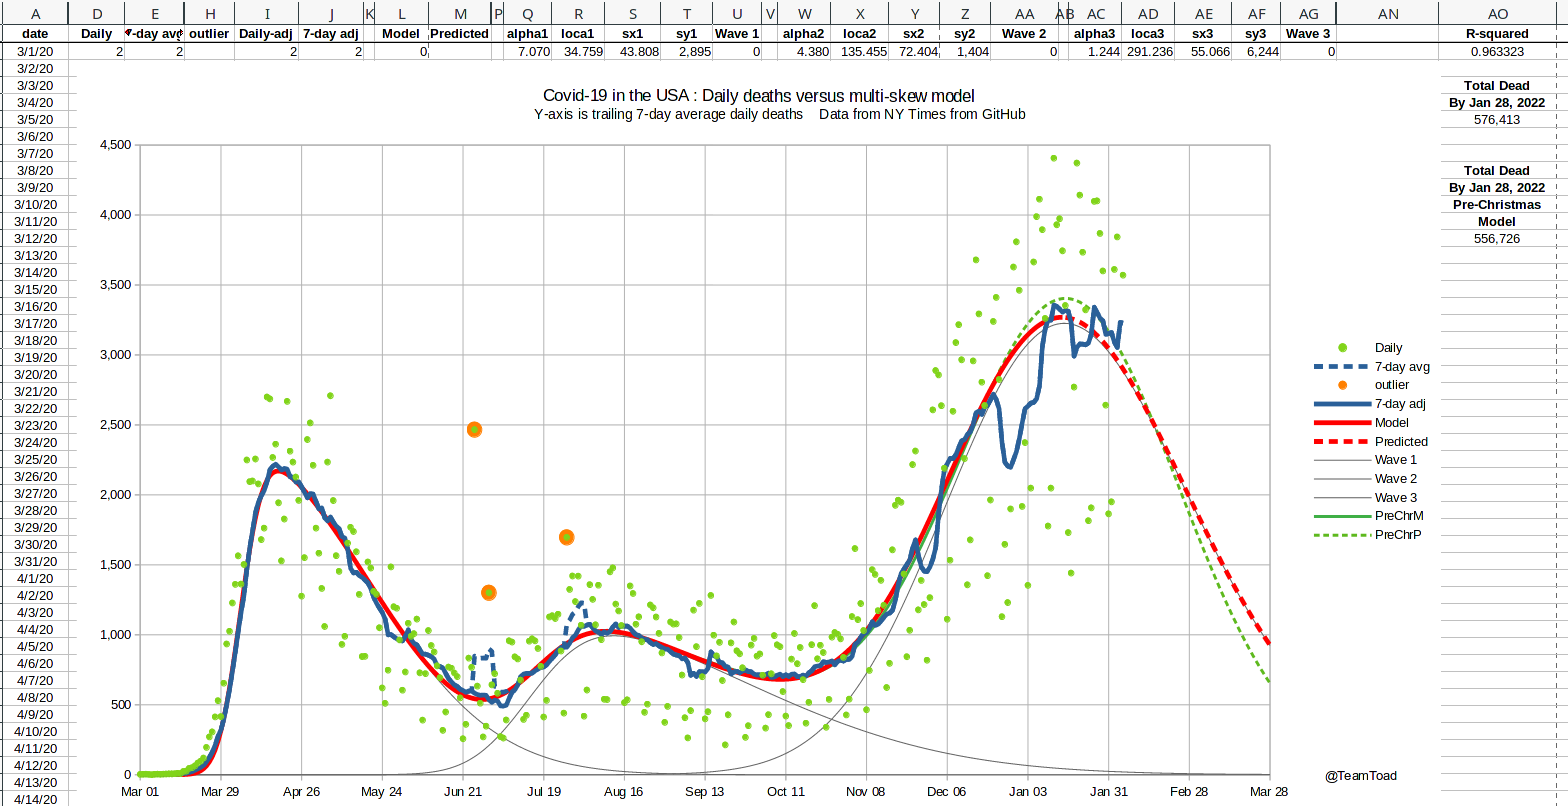
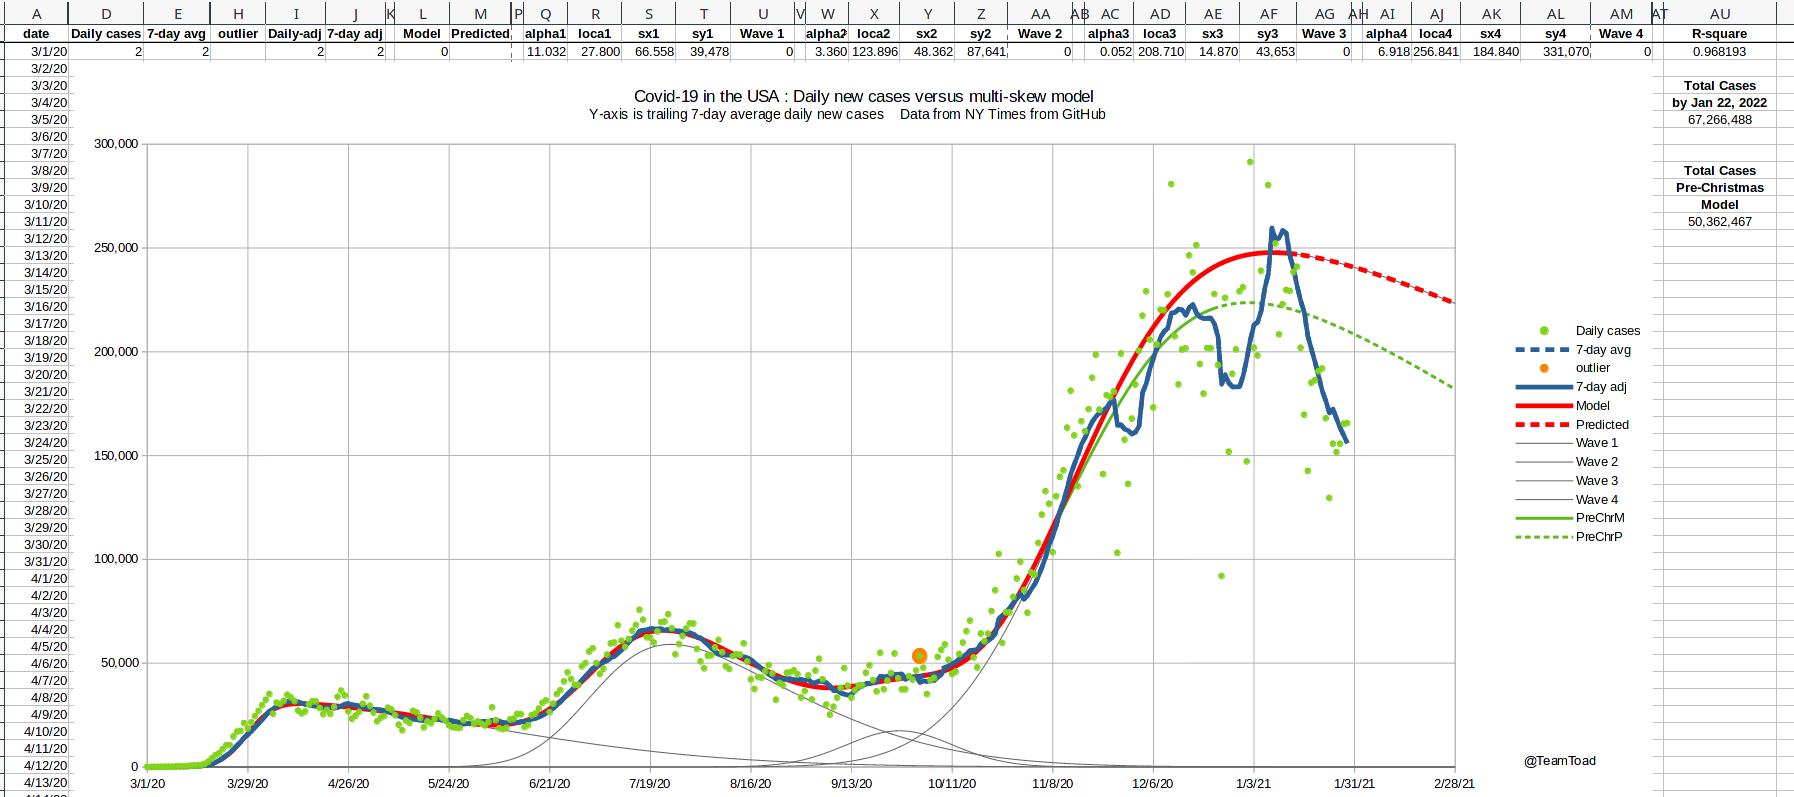
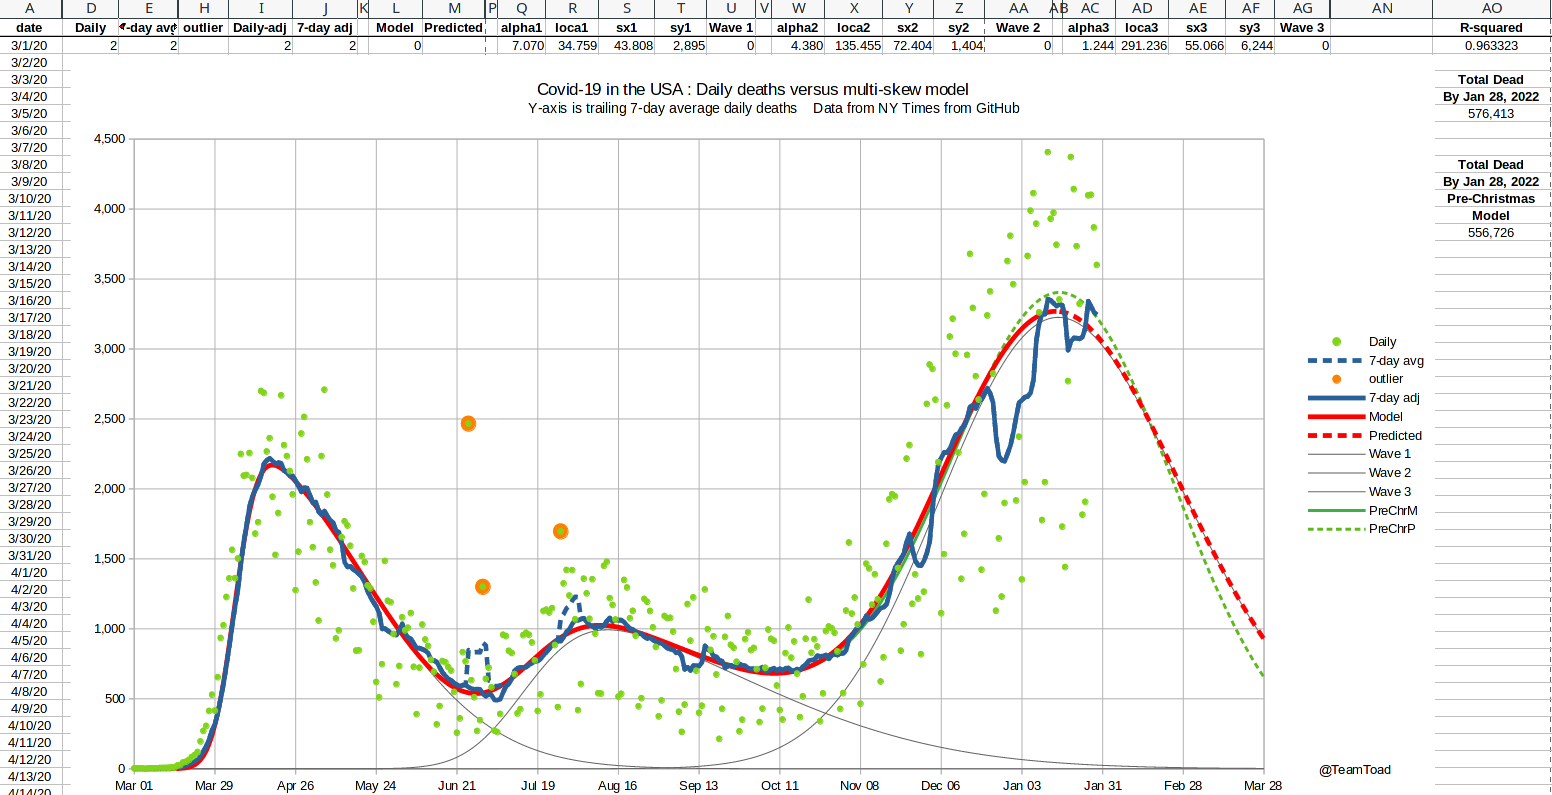
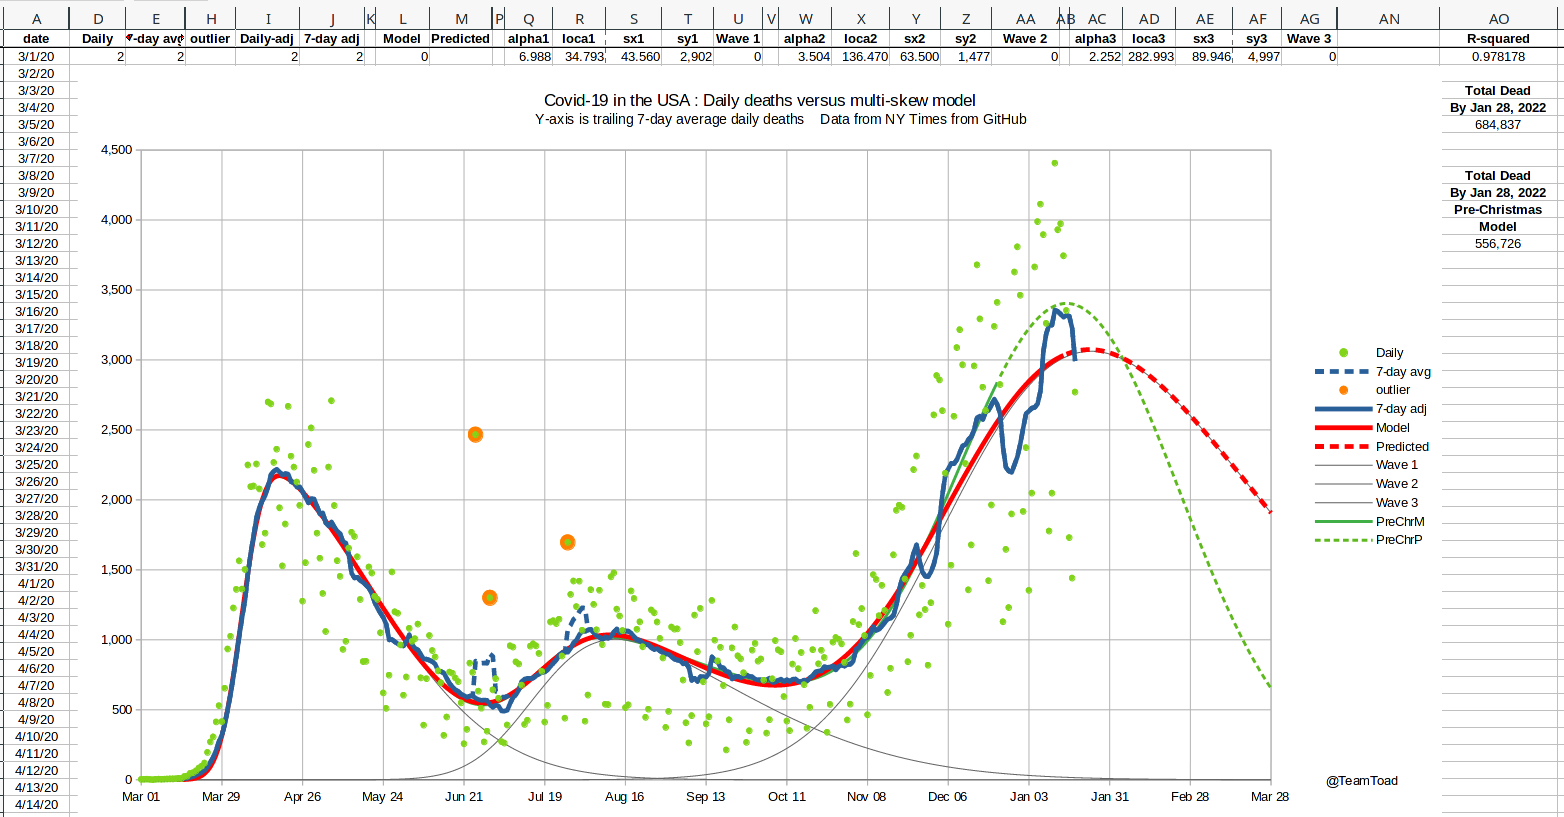
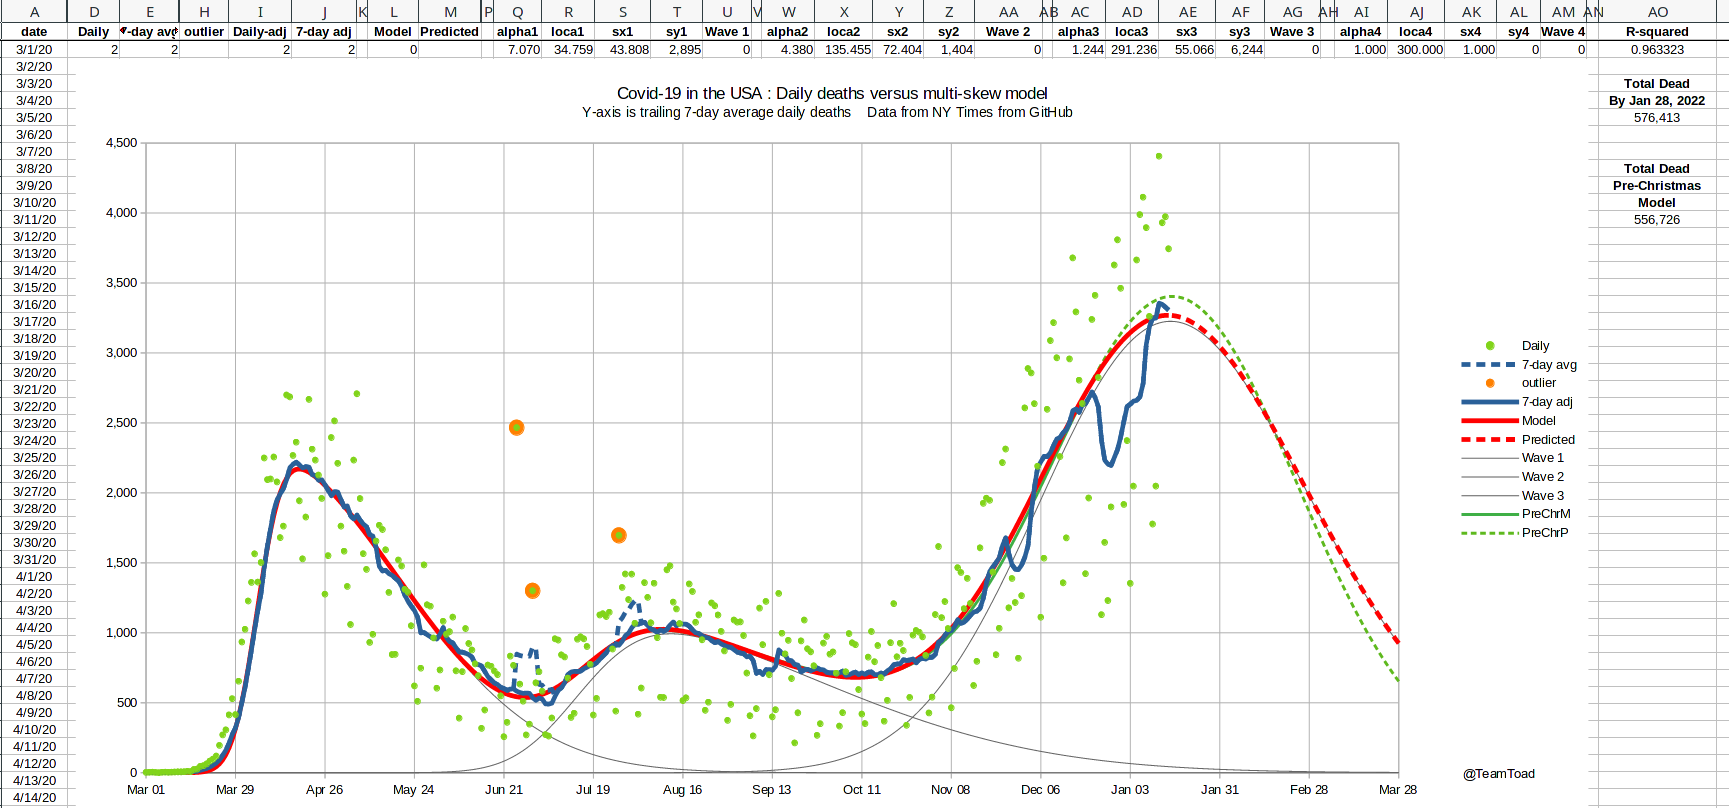
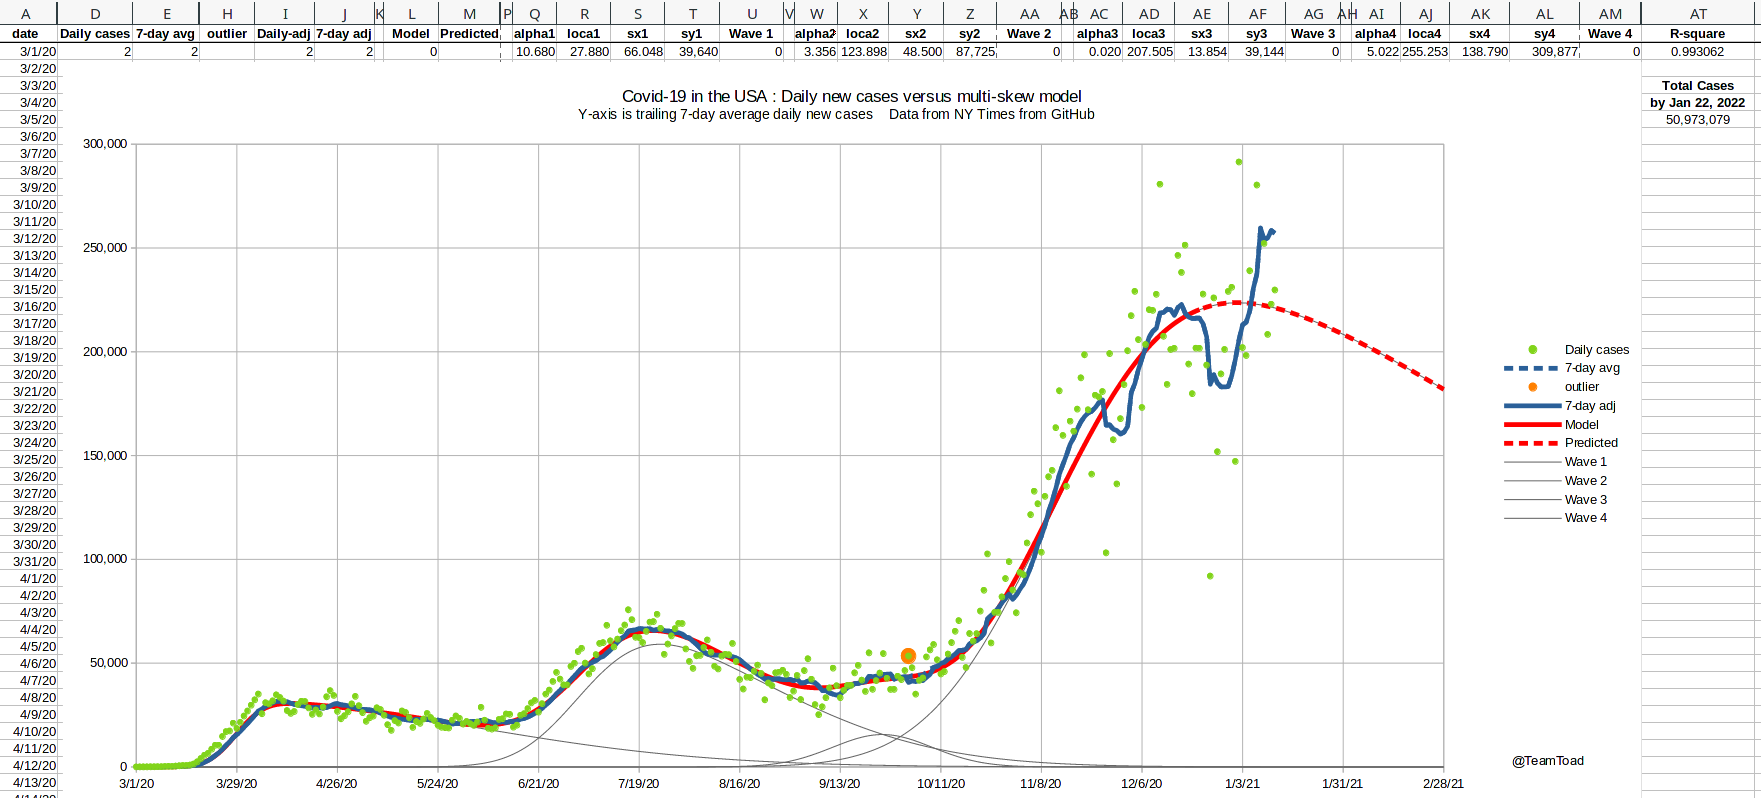
I updated the US cases and
US deaths using
data posted today for 1/15/2021, and ran new curve fits for both.
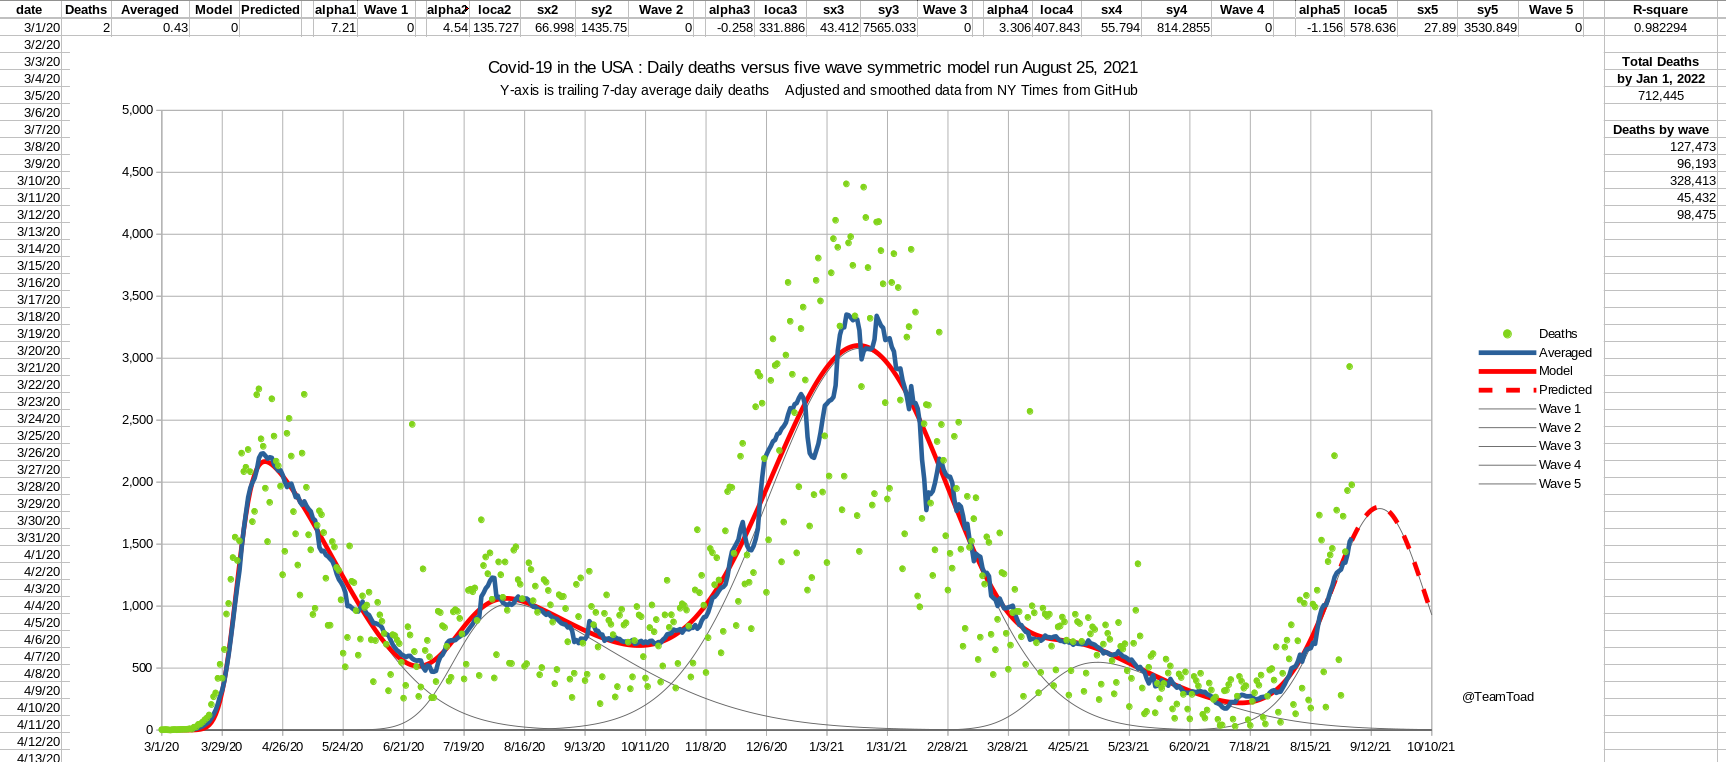
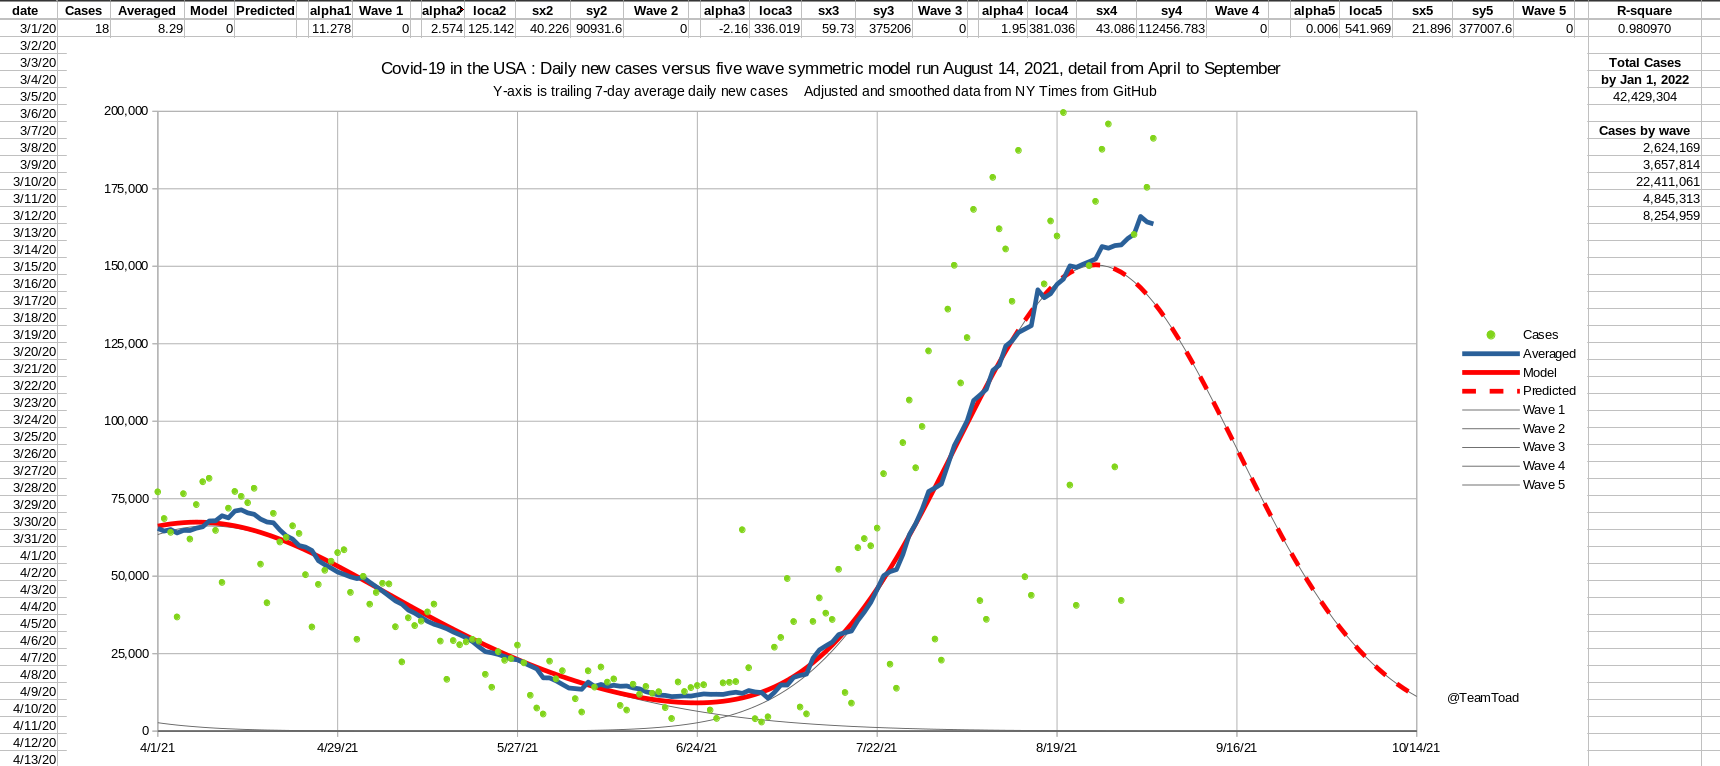
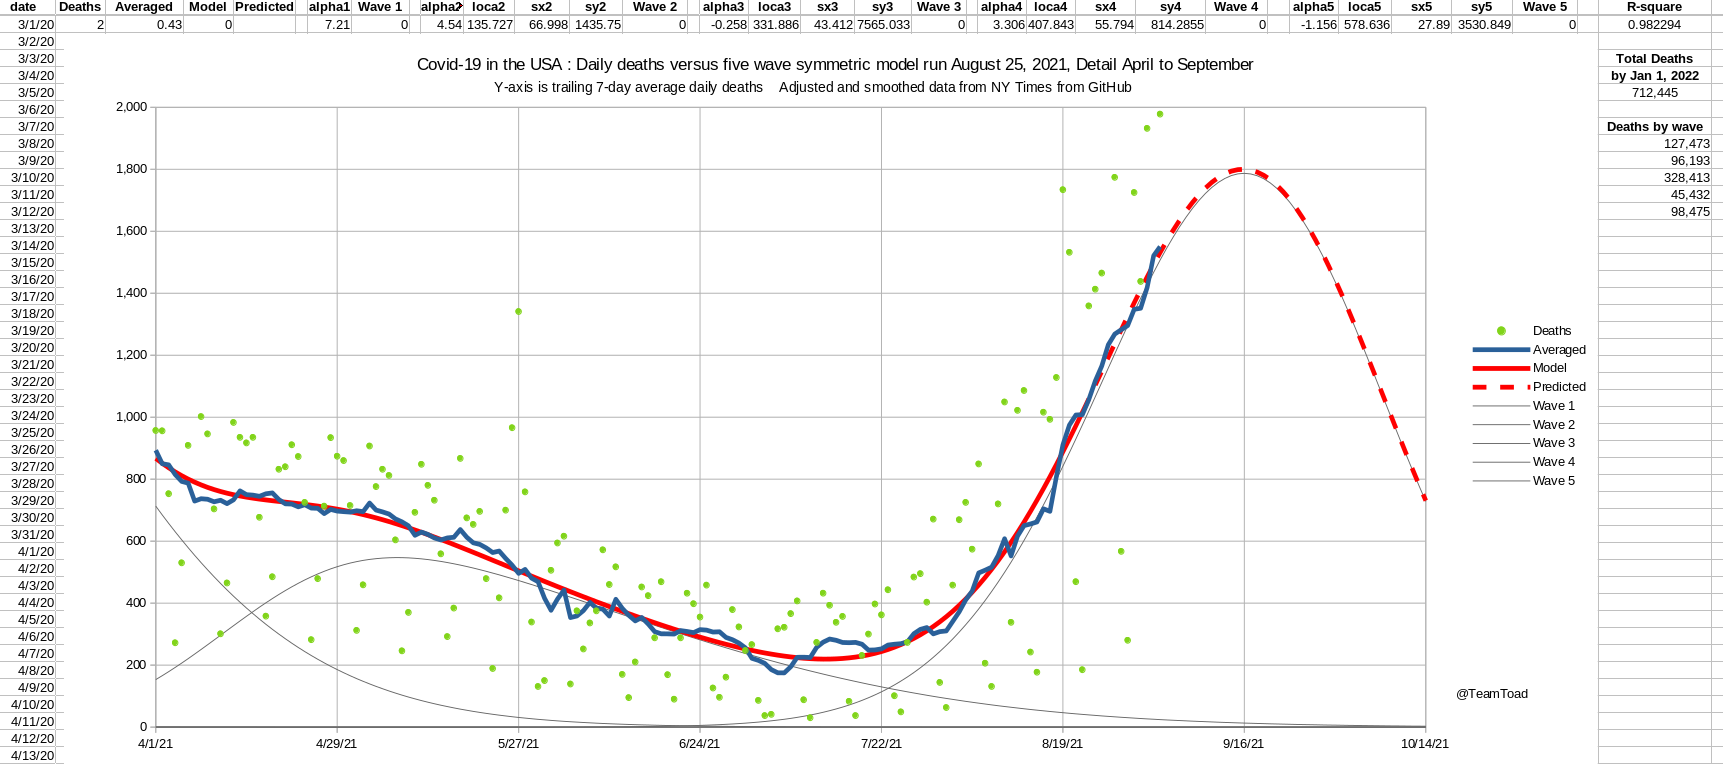
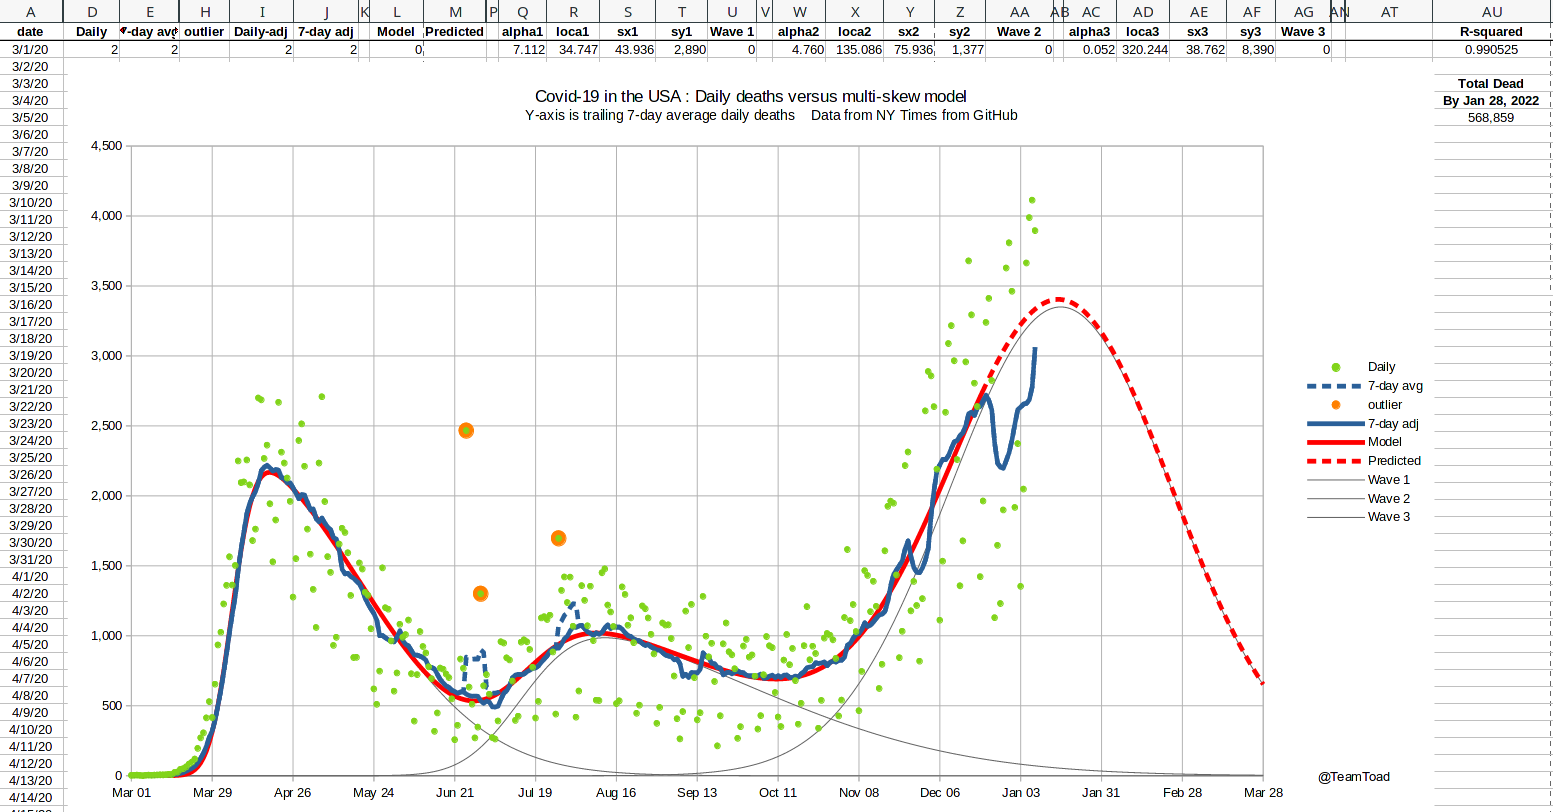
The new case model (left, red) is 11% higher than the pre-Christmas model (left, green), with a peak about one week later (Jan 1 at 223,655 before and Jan 8 at 247,792 in the new model). The new death model (right, red) is actually 4% lower than the pre-Christmas model (right, green), with a peak one day earlier (Jan 16 at 3,404 before and Jan 15 at 3,269 in the new model). |
 |
 |
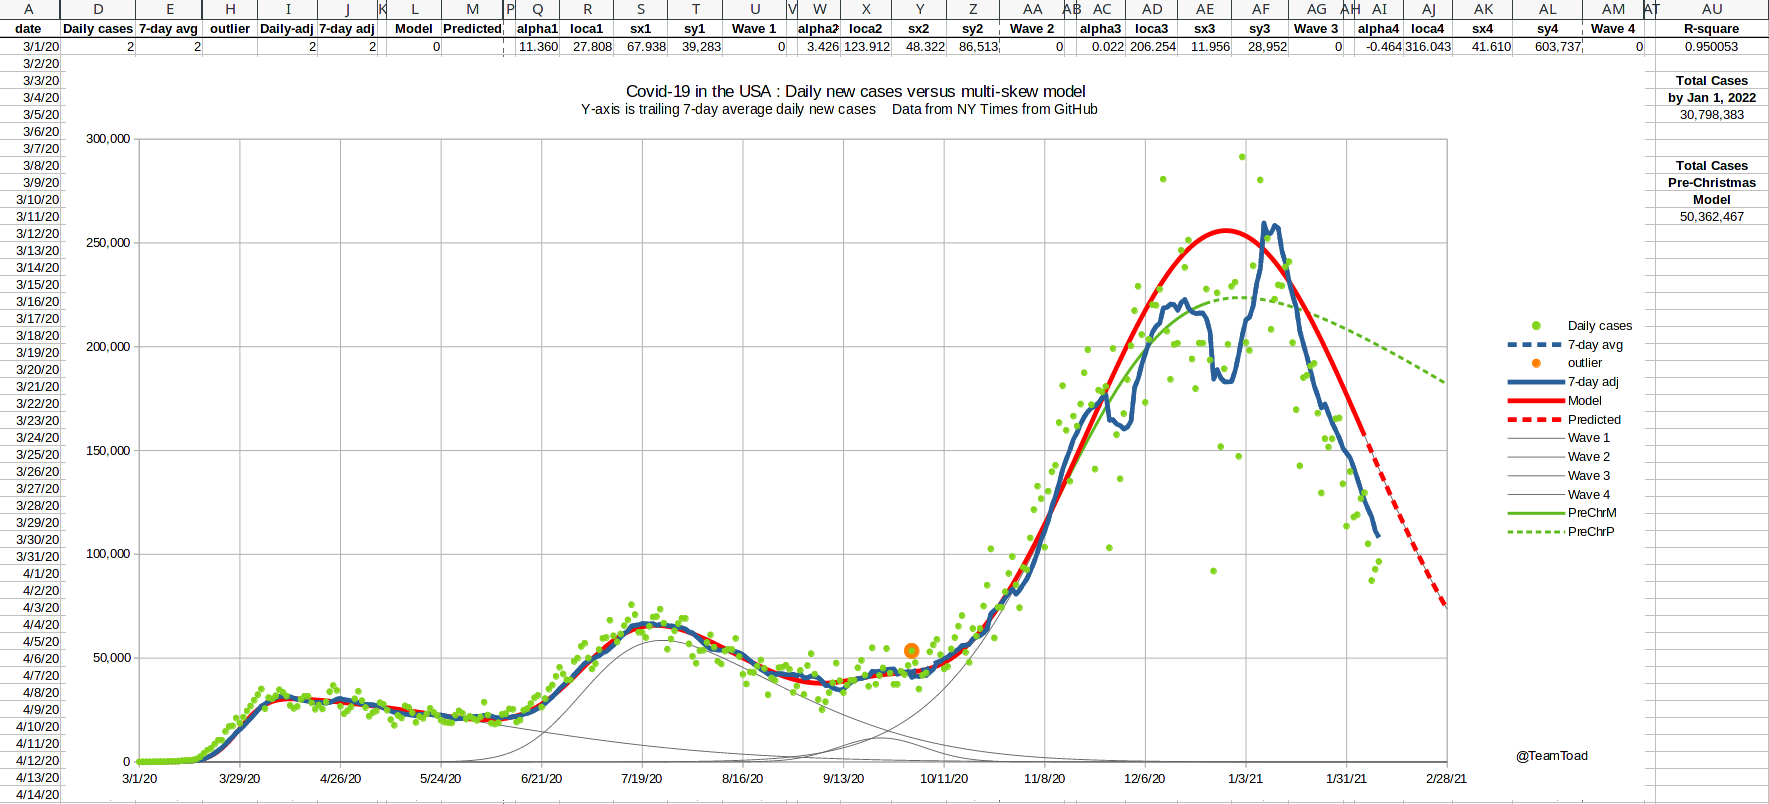
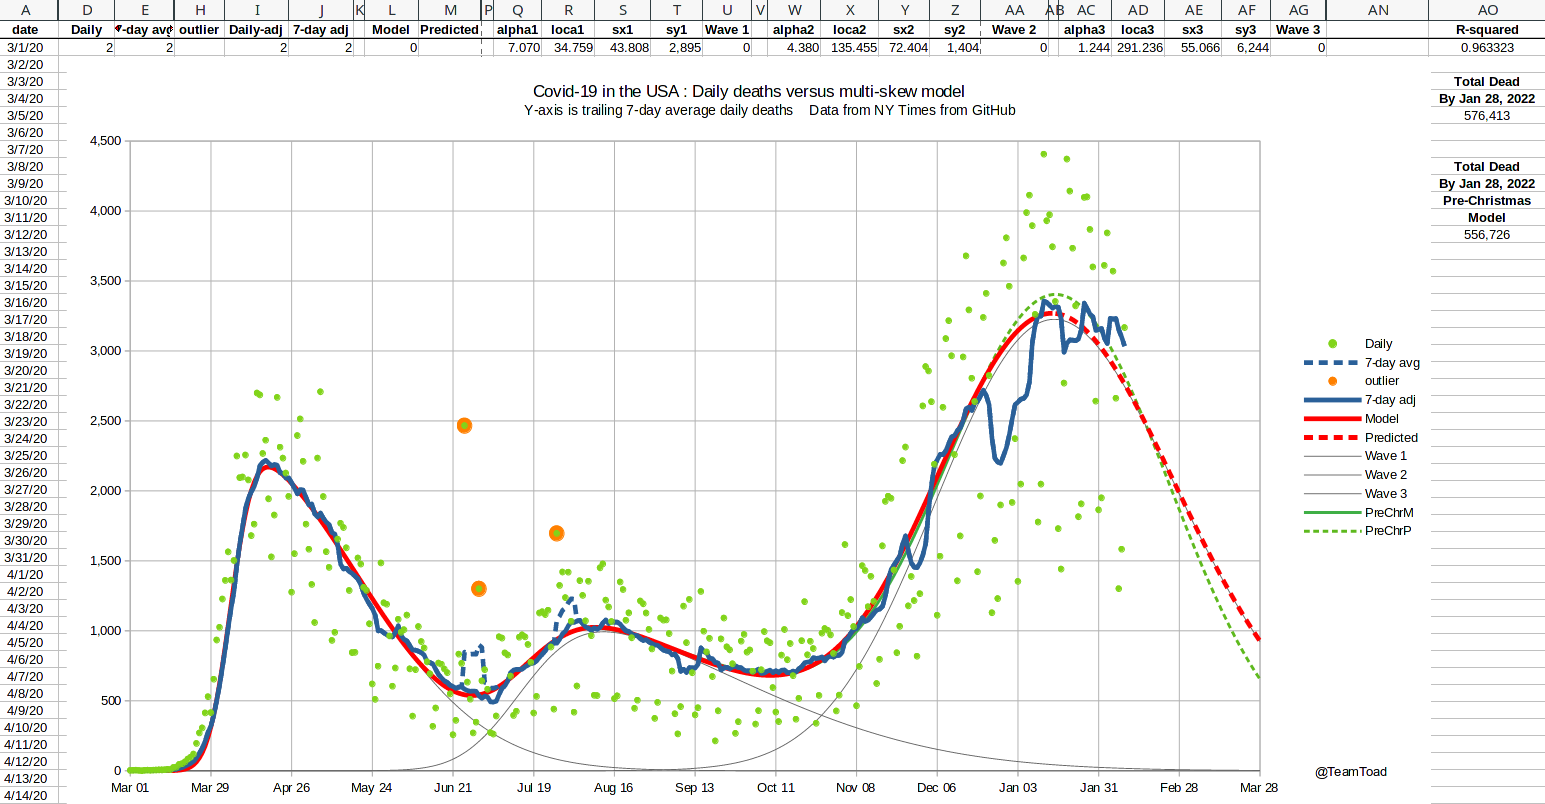
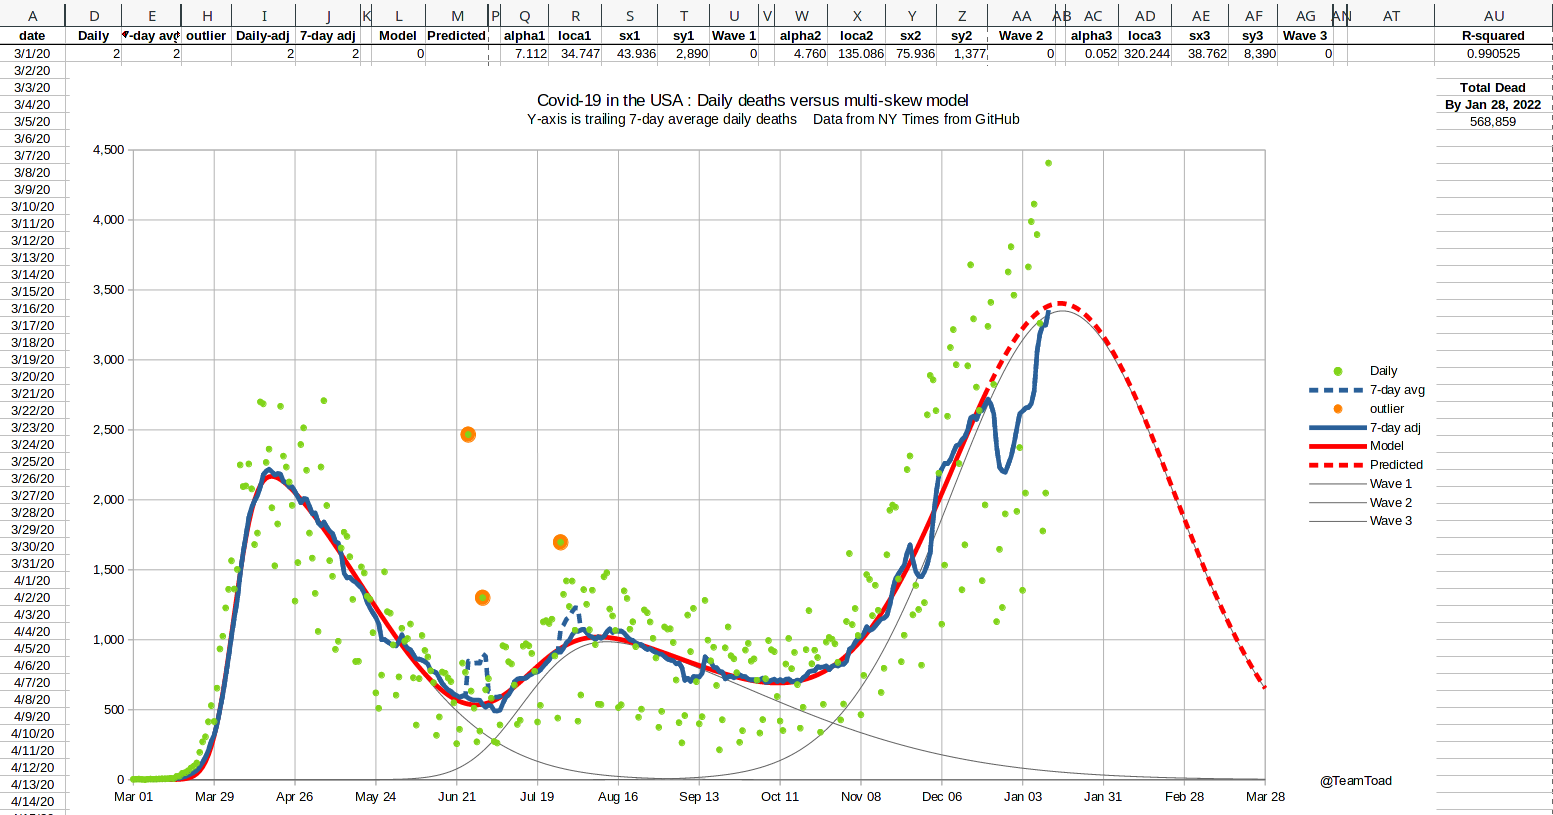
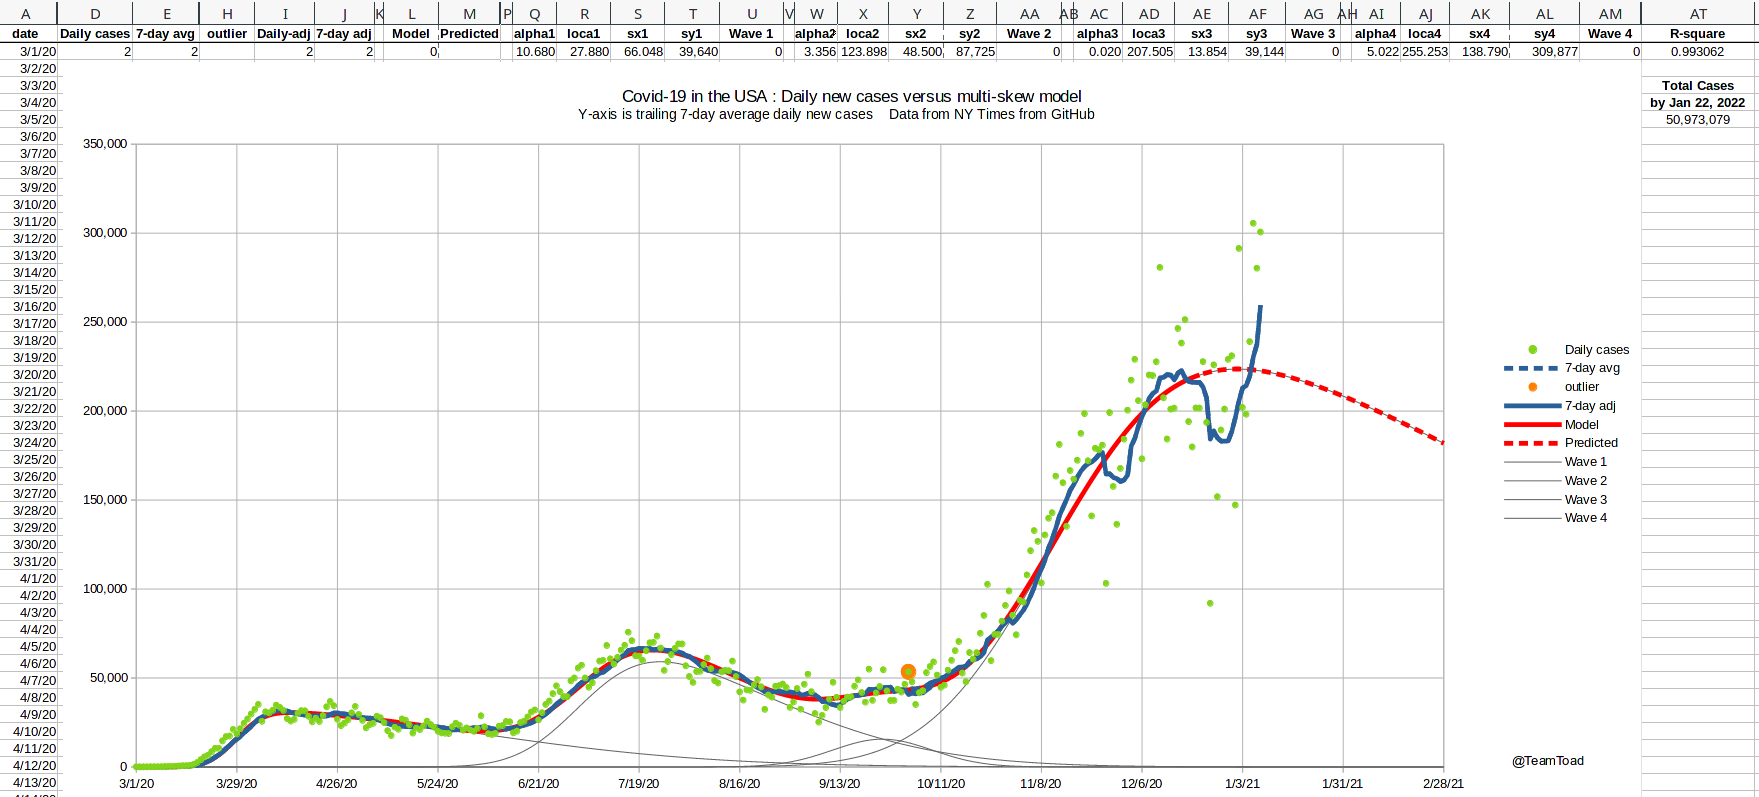
Added US cases and
US deaths using
data posted today for 1/12/2021.
Cases (left) are above the trend line from the pre-Christmas model run, but they are steady for the last 5 days (using a 7-day trailing average). Deaths (right) are higher, but are also growing less rapidly, and have just reached the pre-Christmas model trend line. |
 |
 |
Added US cases and
US deaths using
data posted today for 1/08/2021.
Cases (left) are above the trend line from the pre-Christmas model run. That probably indicates a new acceleration in the spread of the virus. Deaths (right) are higher, but are not yet above the pre-Christmas model trend line. |
 |
|
Added US cases and
US deaths using
data posted today for 1/06/2021.
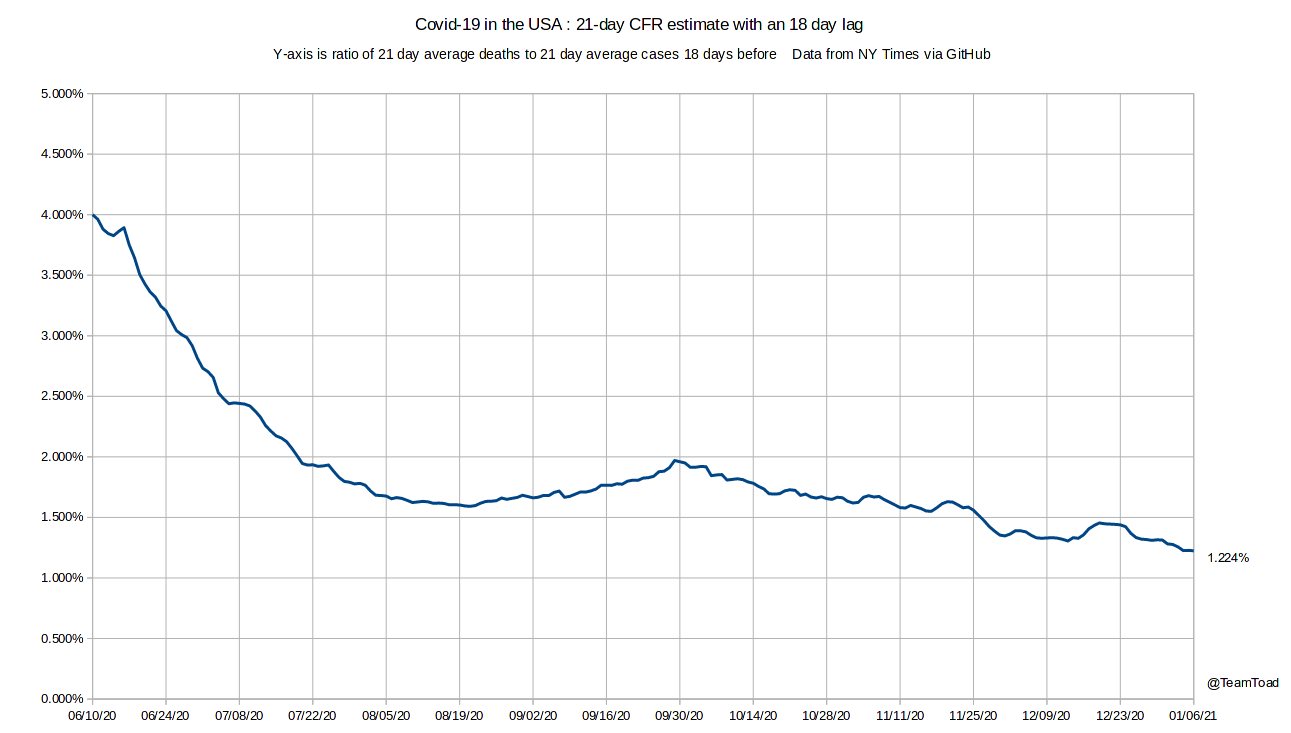
Cases are back to the trend line established before the Christmas holiday. The public expectation is that cases will climb sharply from here, assuming lots of family interaction over Christmas. Remember this model just fits the historical data, and has no knowledge of social interaction rates per se. As always, nothing predicts or prevents a new wave. Also added a new estimate for Case Fatality Rate (CFR) showing 1.224% for the last 21 days (shown at right). That corresponds to one death per 81 cases, an improvement over 1 death in 70 cases last month. |
|
Graph Update, December 26, 2020The first version of the Data Groupies web site is up. The first thing to check out is the Theory page, which describes how I use the skew-normal distribution to model the cases and deaths in the coronavirus epidemic. |
 |